What is a composite photo?
Simply put, a composite photo is made up of several shots. A very simple example: when you take a panoramic photo with your smartphone, you are taking a composite photo, because your smartphone will take several shots and assemble them into one to create a panorama.
The different types of composite photos
Assembling photos to create a panoramic view
As explained above, the most common use is simply to take several photos and create a larger one. Depending on how the photos were taken and how you want them to look, it may be necessary to distort them. Below are a few examples of ‘classic’ composite photos.
Panorama of Mars from the Curiosity rover 1
Here’s a panorama of Mars made up of more than 1,000 photos taken between 24 November and 1 December 2019.

Credits : NASA / JPL-Caltech / MSSS
By leaving the black outlines visible, you can clearly see the assembly of photos and the distortion applied so that the final photo is true to life.
Panorama of the Moon from the Apollo missions 2
Here is a panorama of the Moon assembled using photos taken by the Apollo 17 mission.

Credits : NASA / Apollo 17 crew
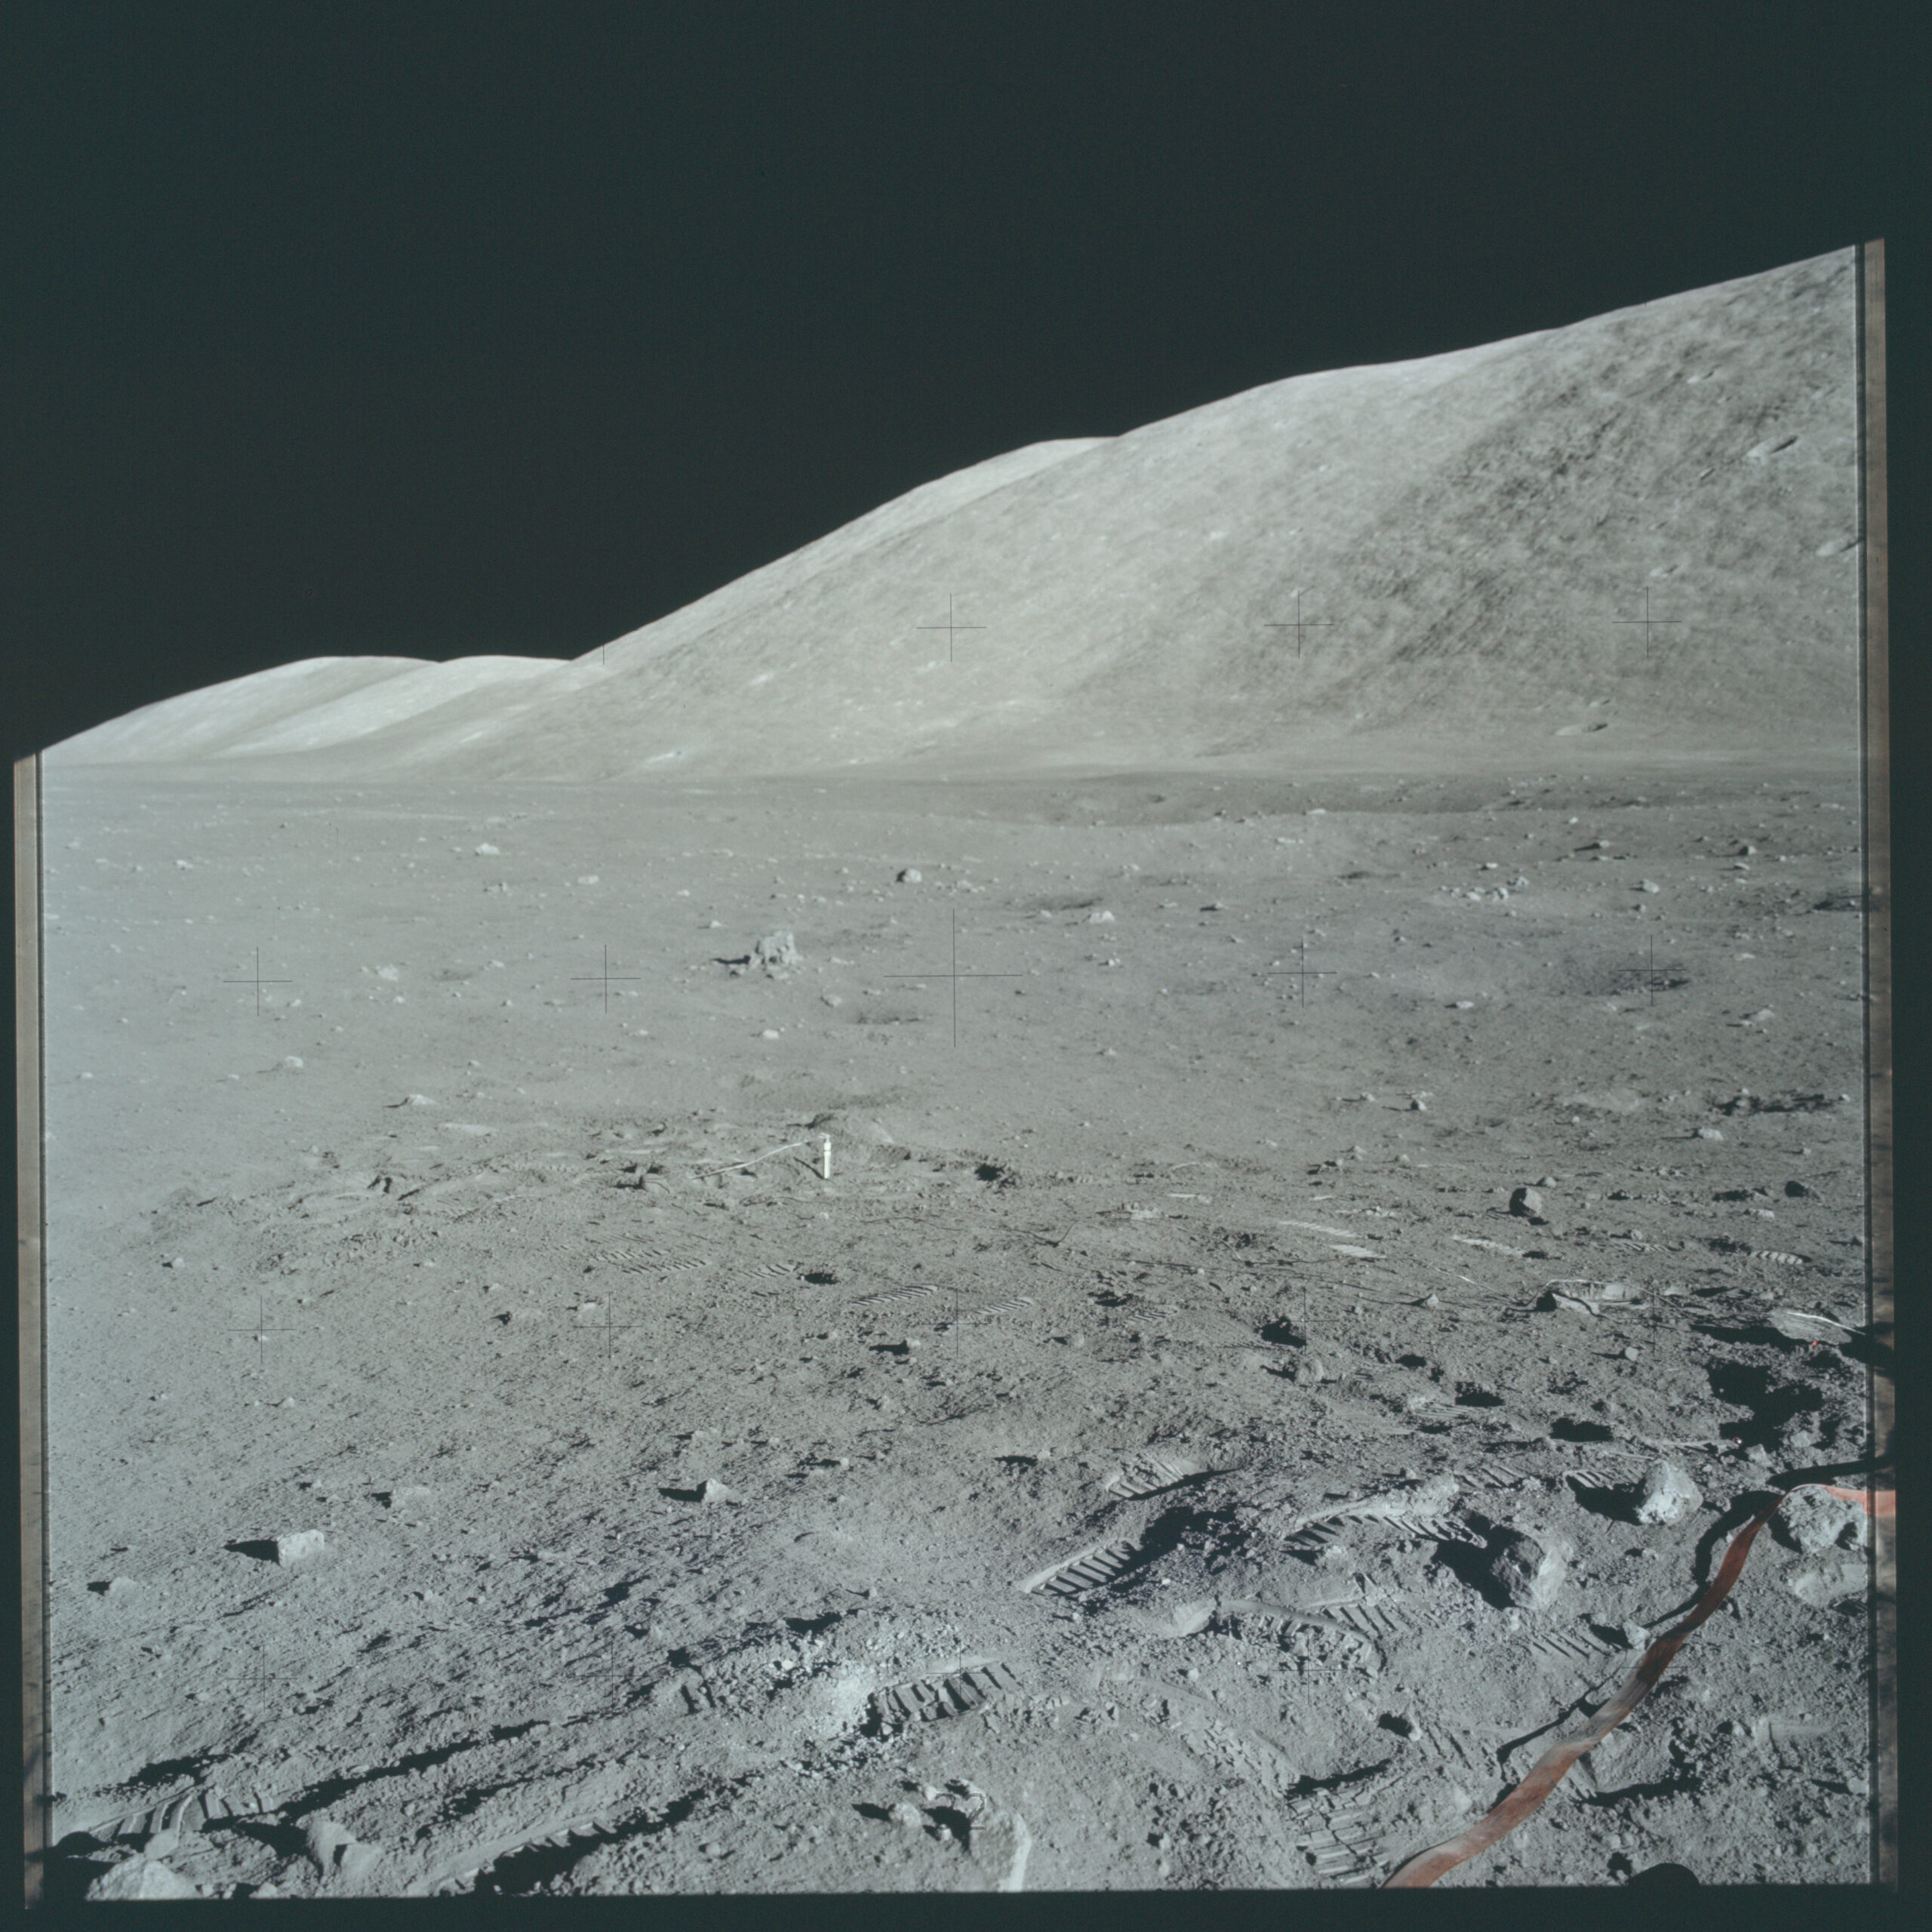
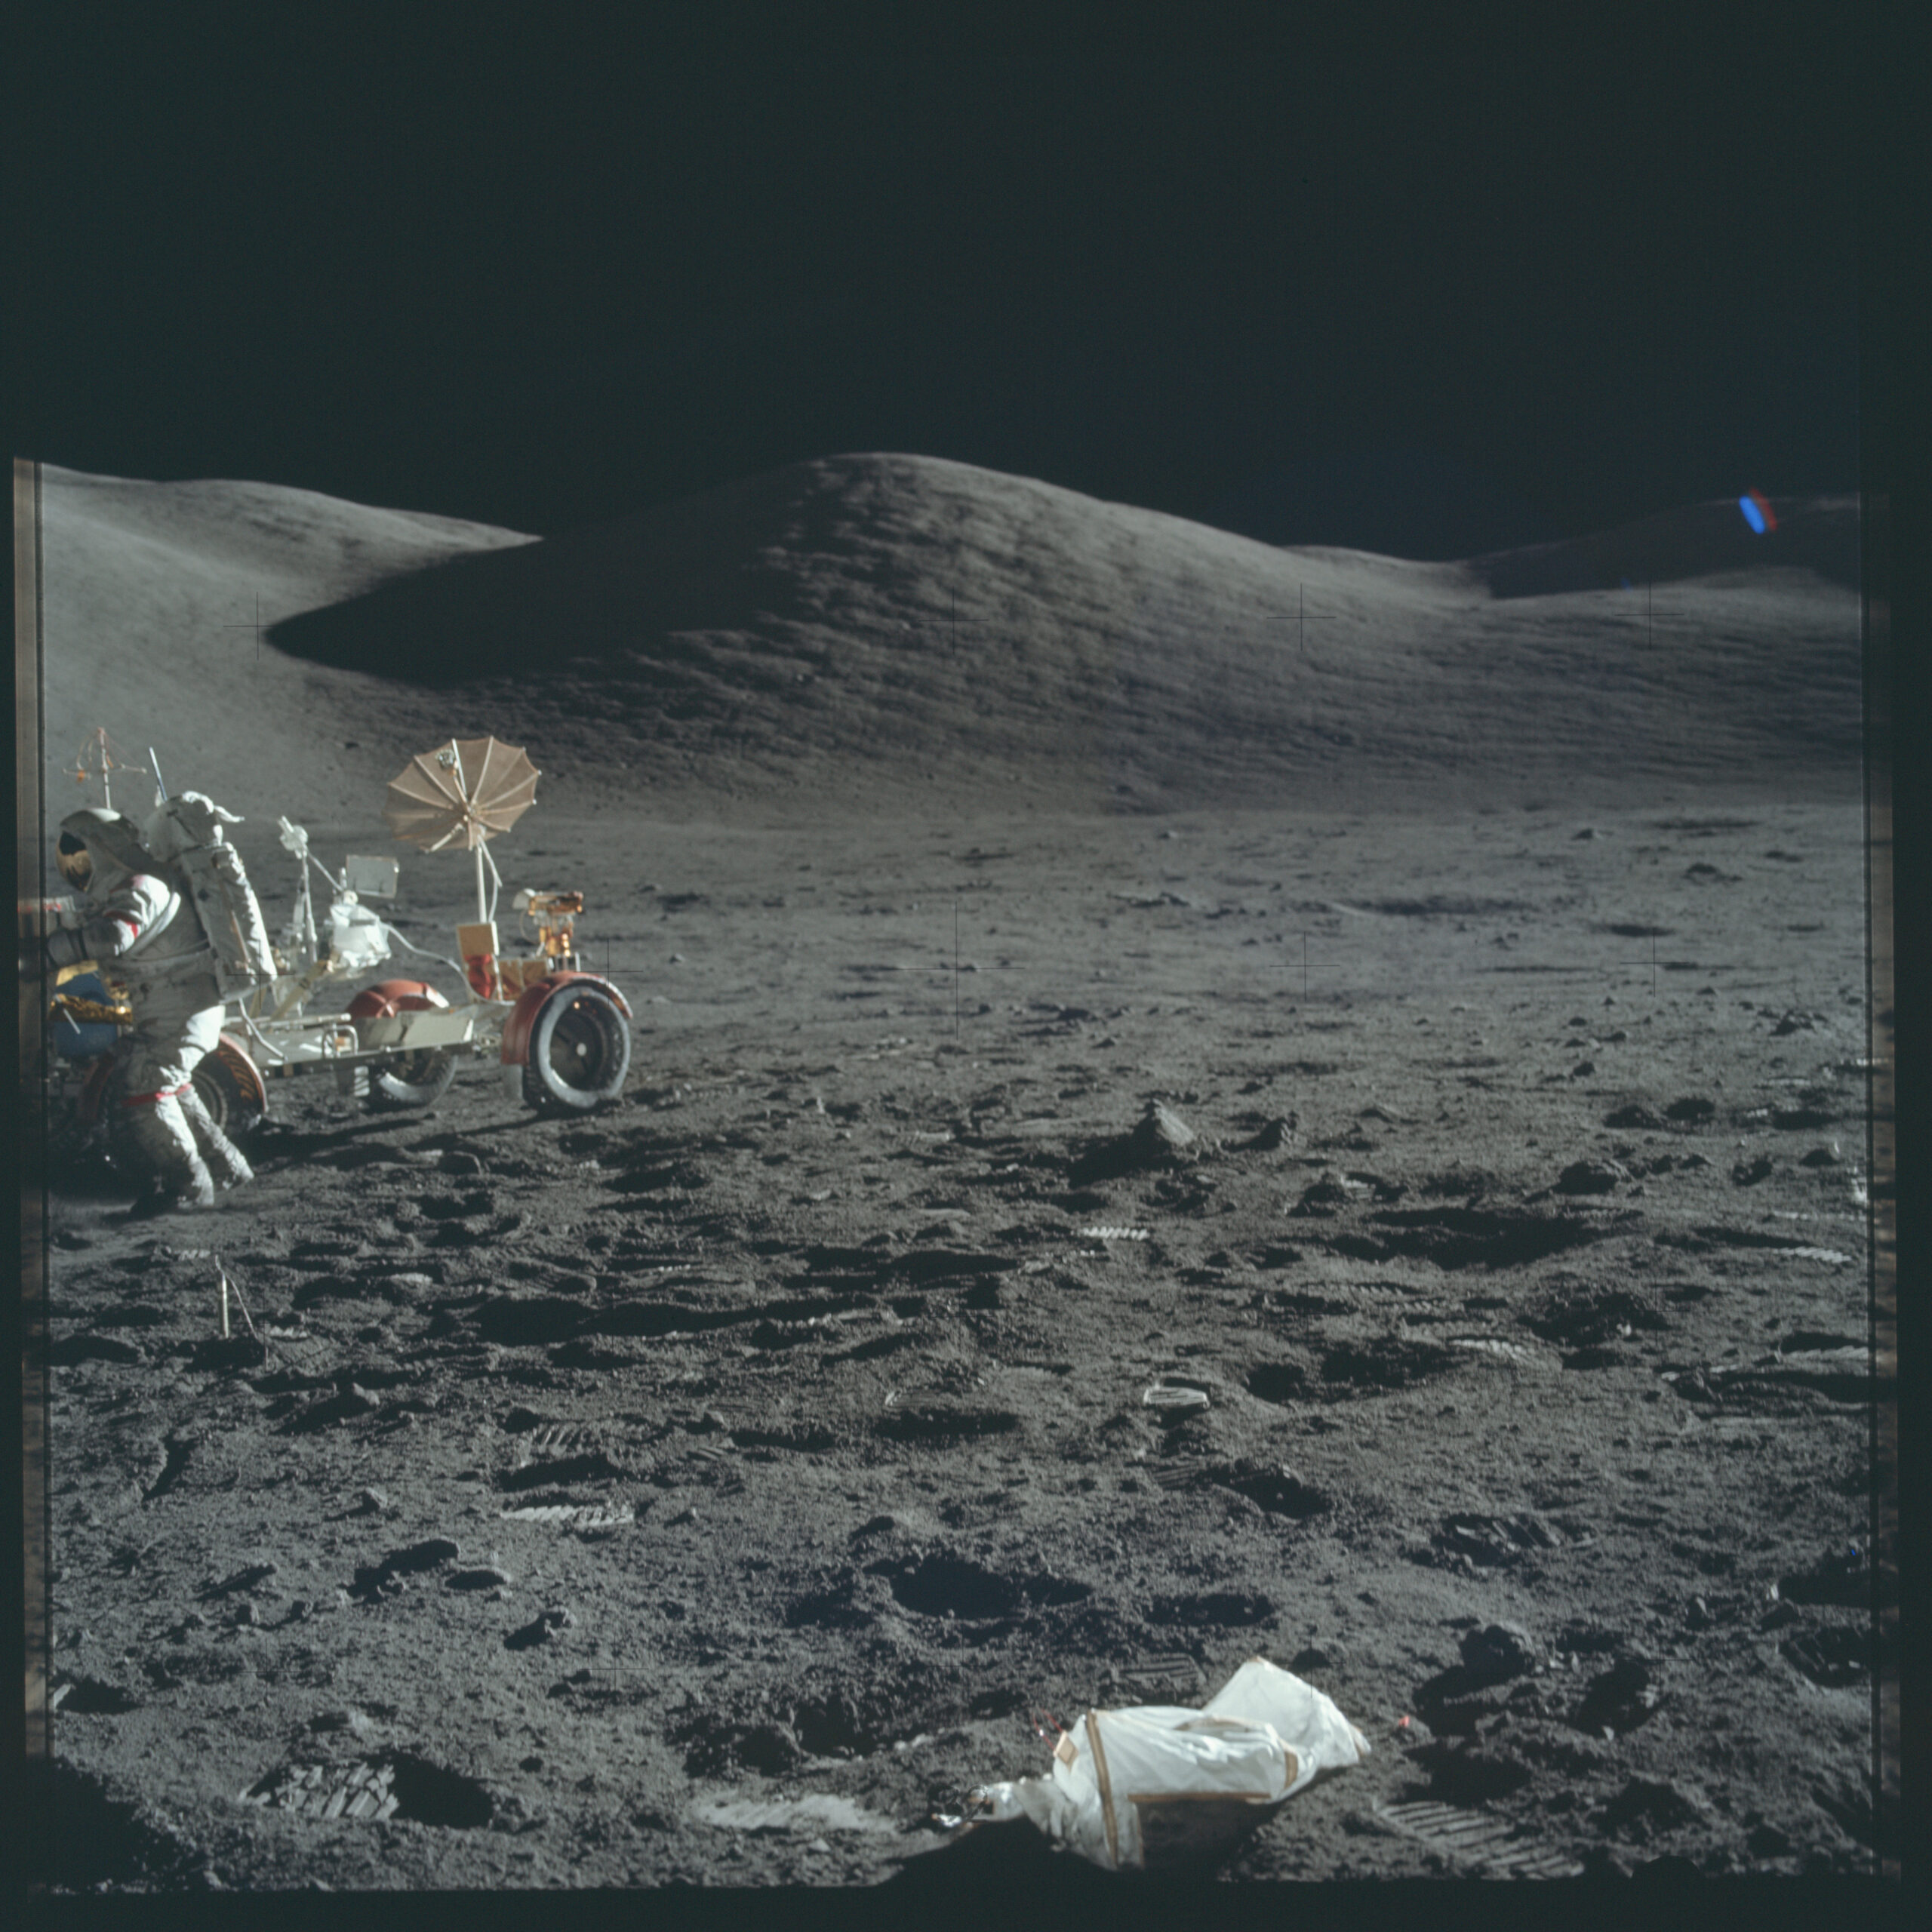
This panorama was assembled using 19 photos, which I’ve put together in the gallery below, to show you that building a composite photo like this doesn’t simply consist of positioning photos next to each other. The photos need to be distorted and superimposed so that the result is perfect. Indeed, as you can see, some elements are present in several photos, such as the ALSEP (Apollo Lunar Surface Experiments Package 3) visible in photos AS17-147-22585, AS17-147-22586 and AS17-147-22587, or the radioisotope thermoelectric generator 4 visible in photos AS17-147-22582 and AS17-147-22583.


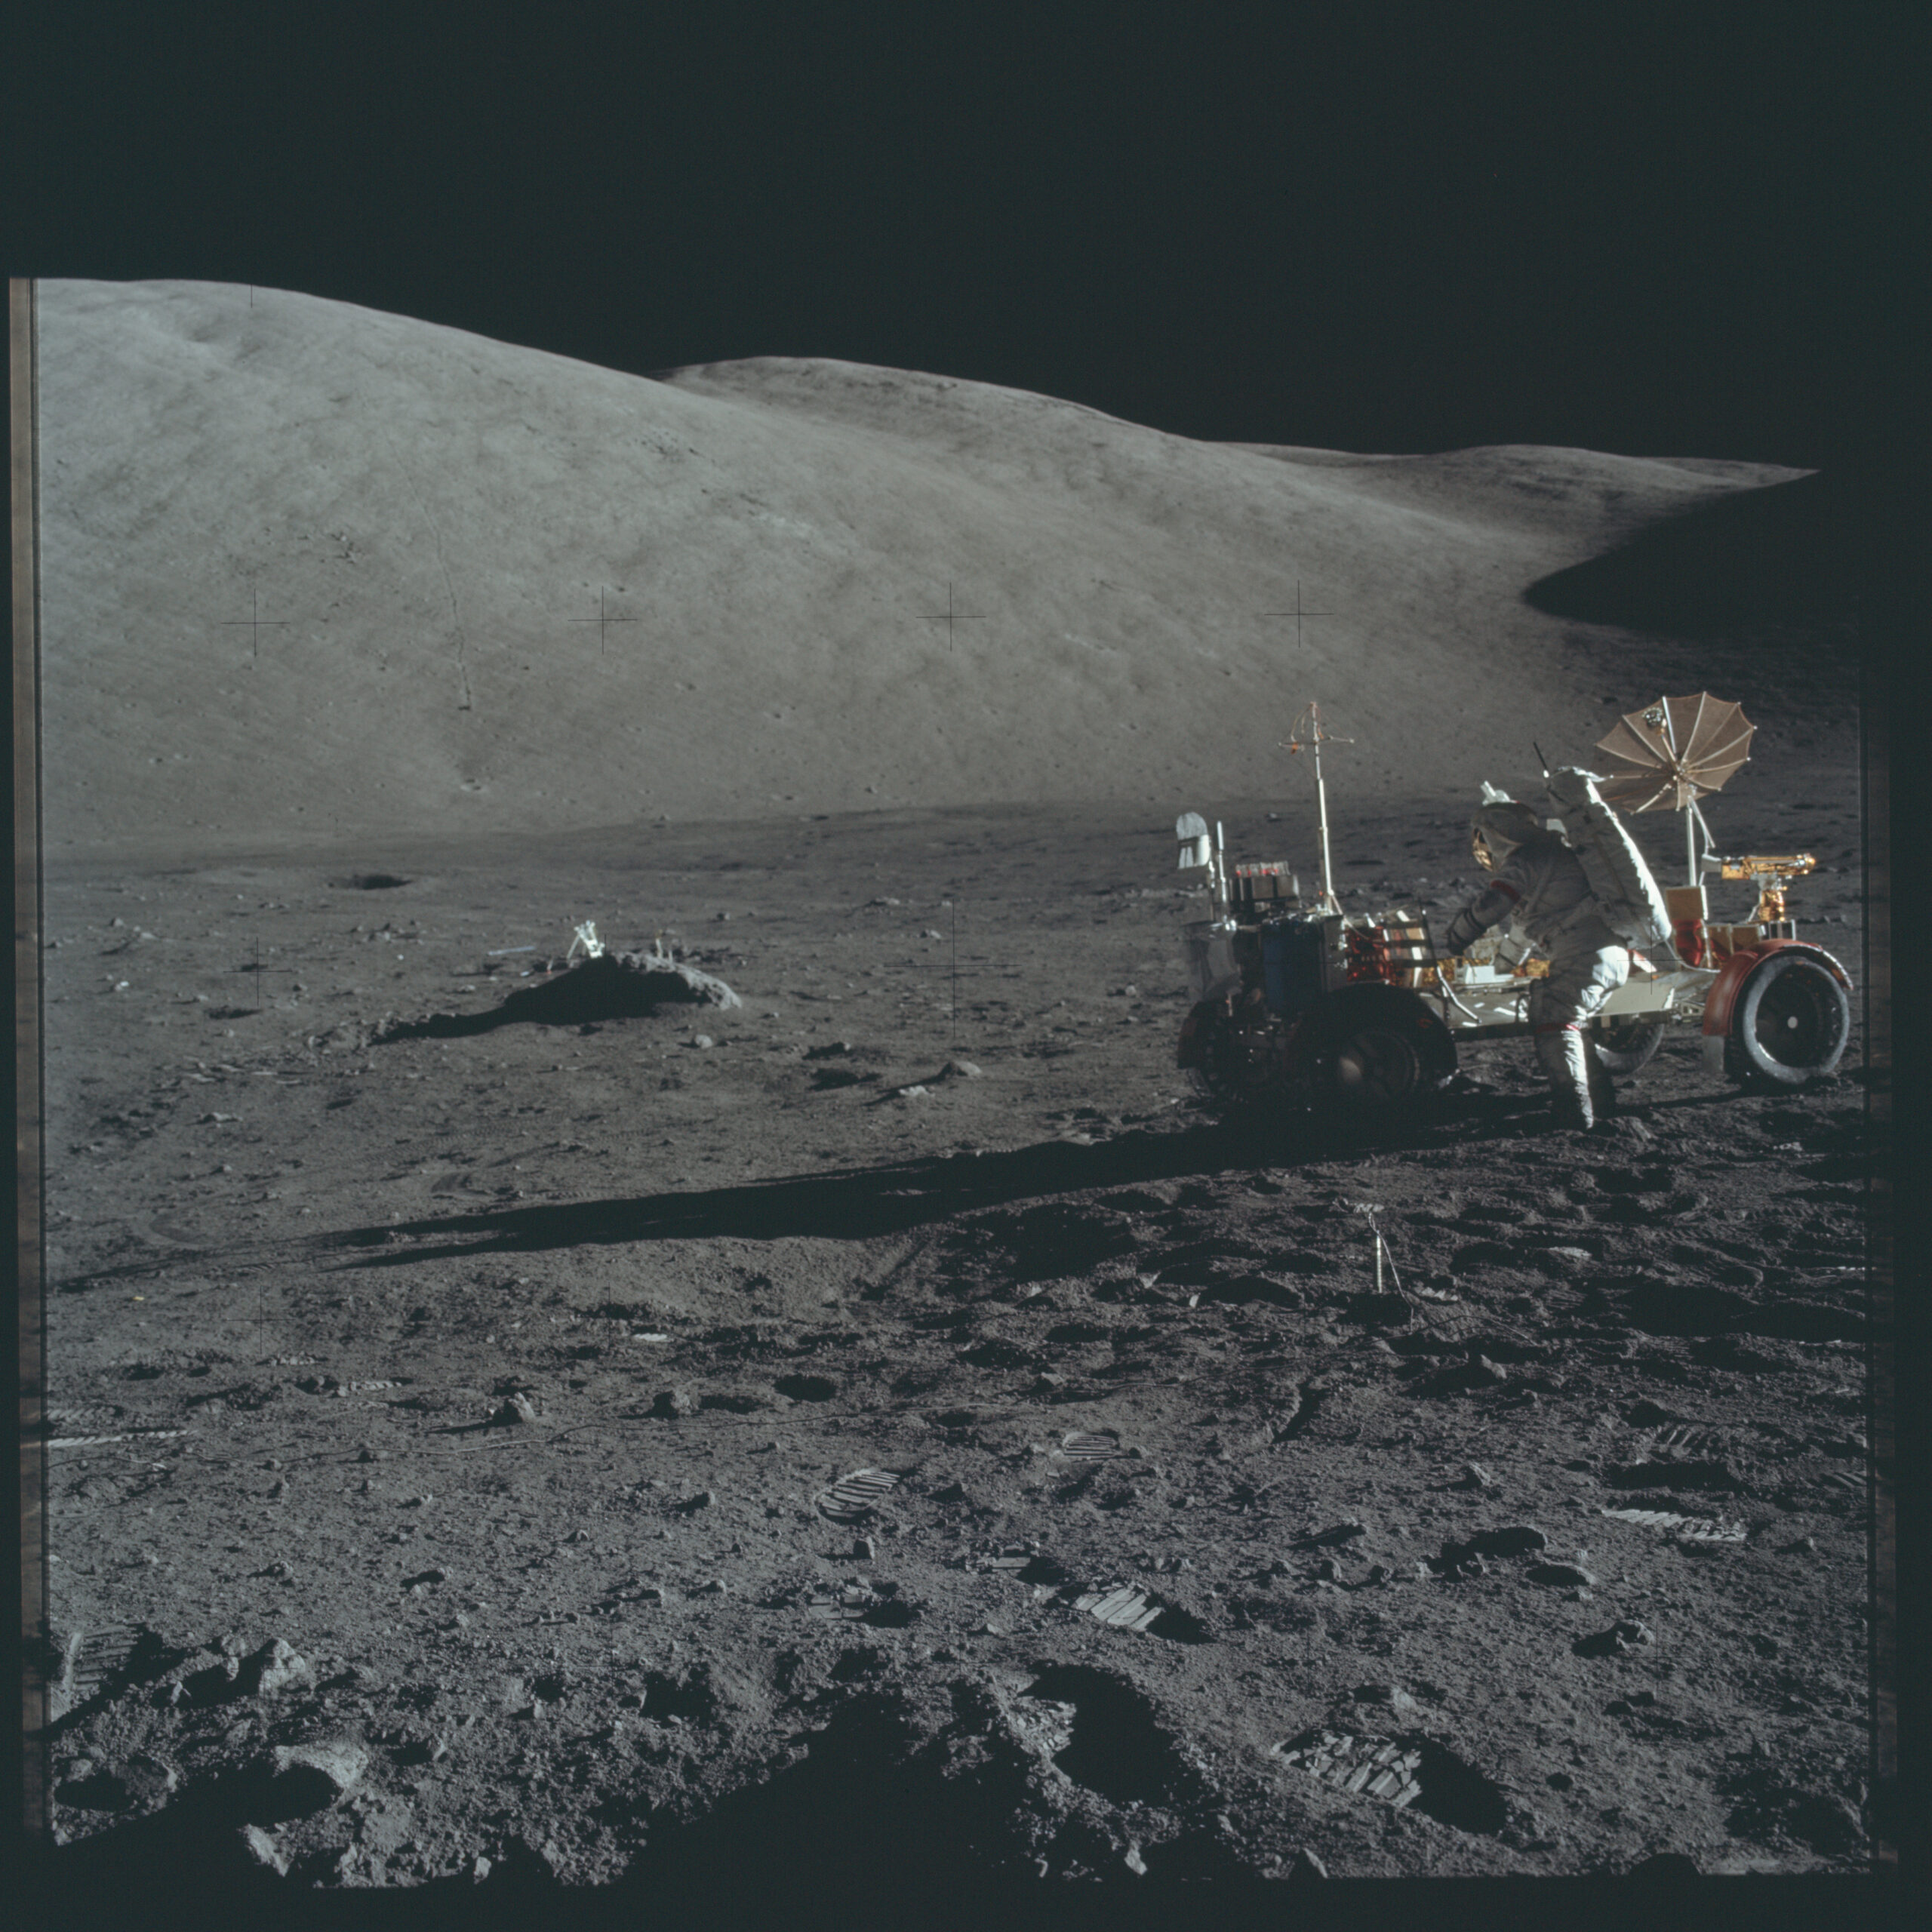
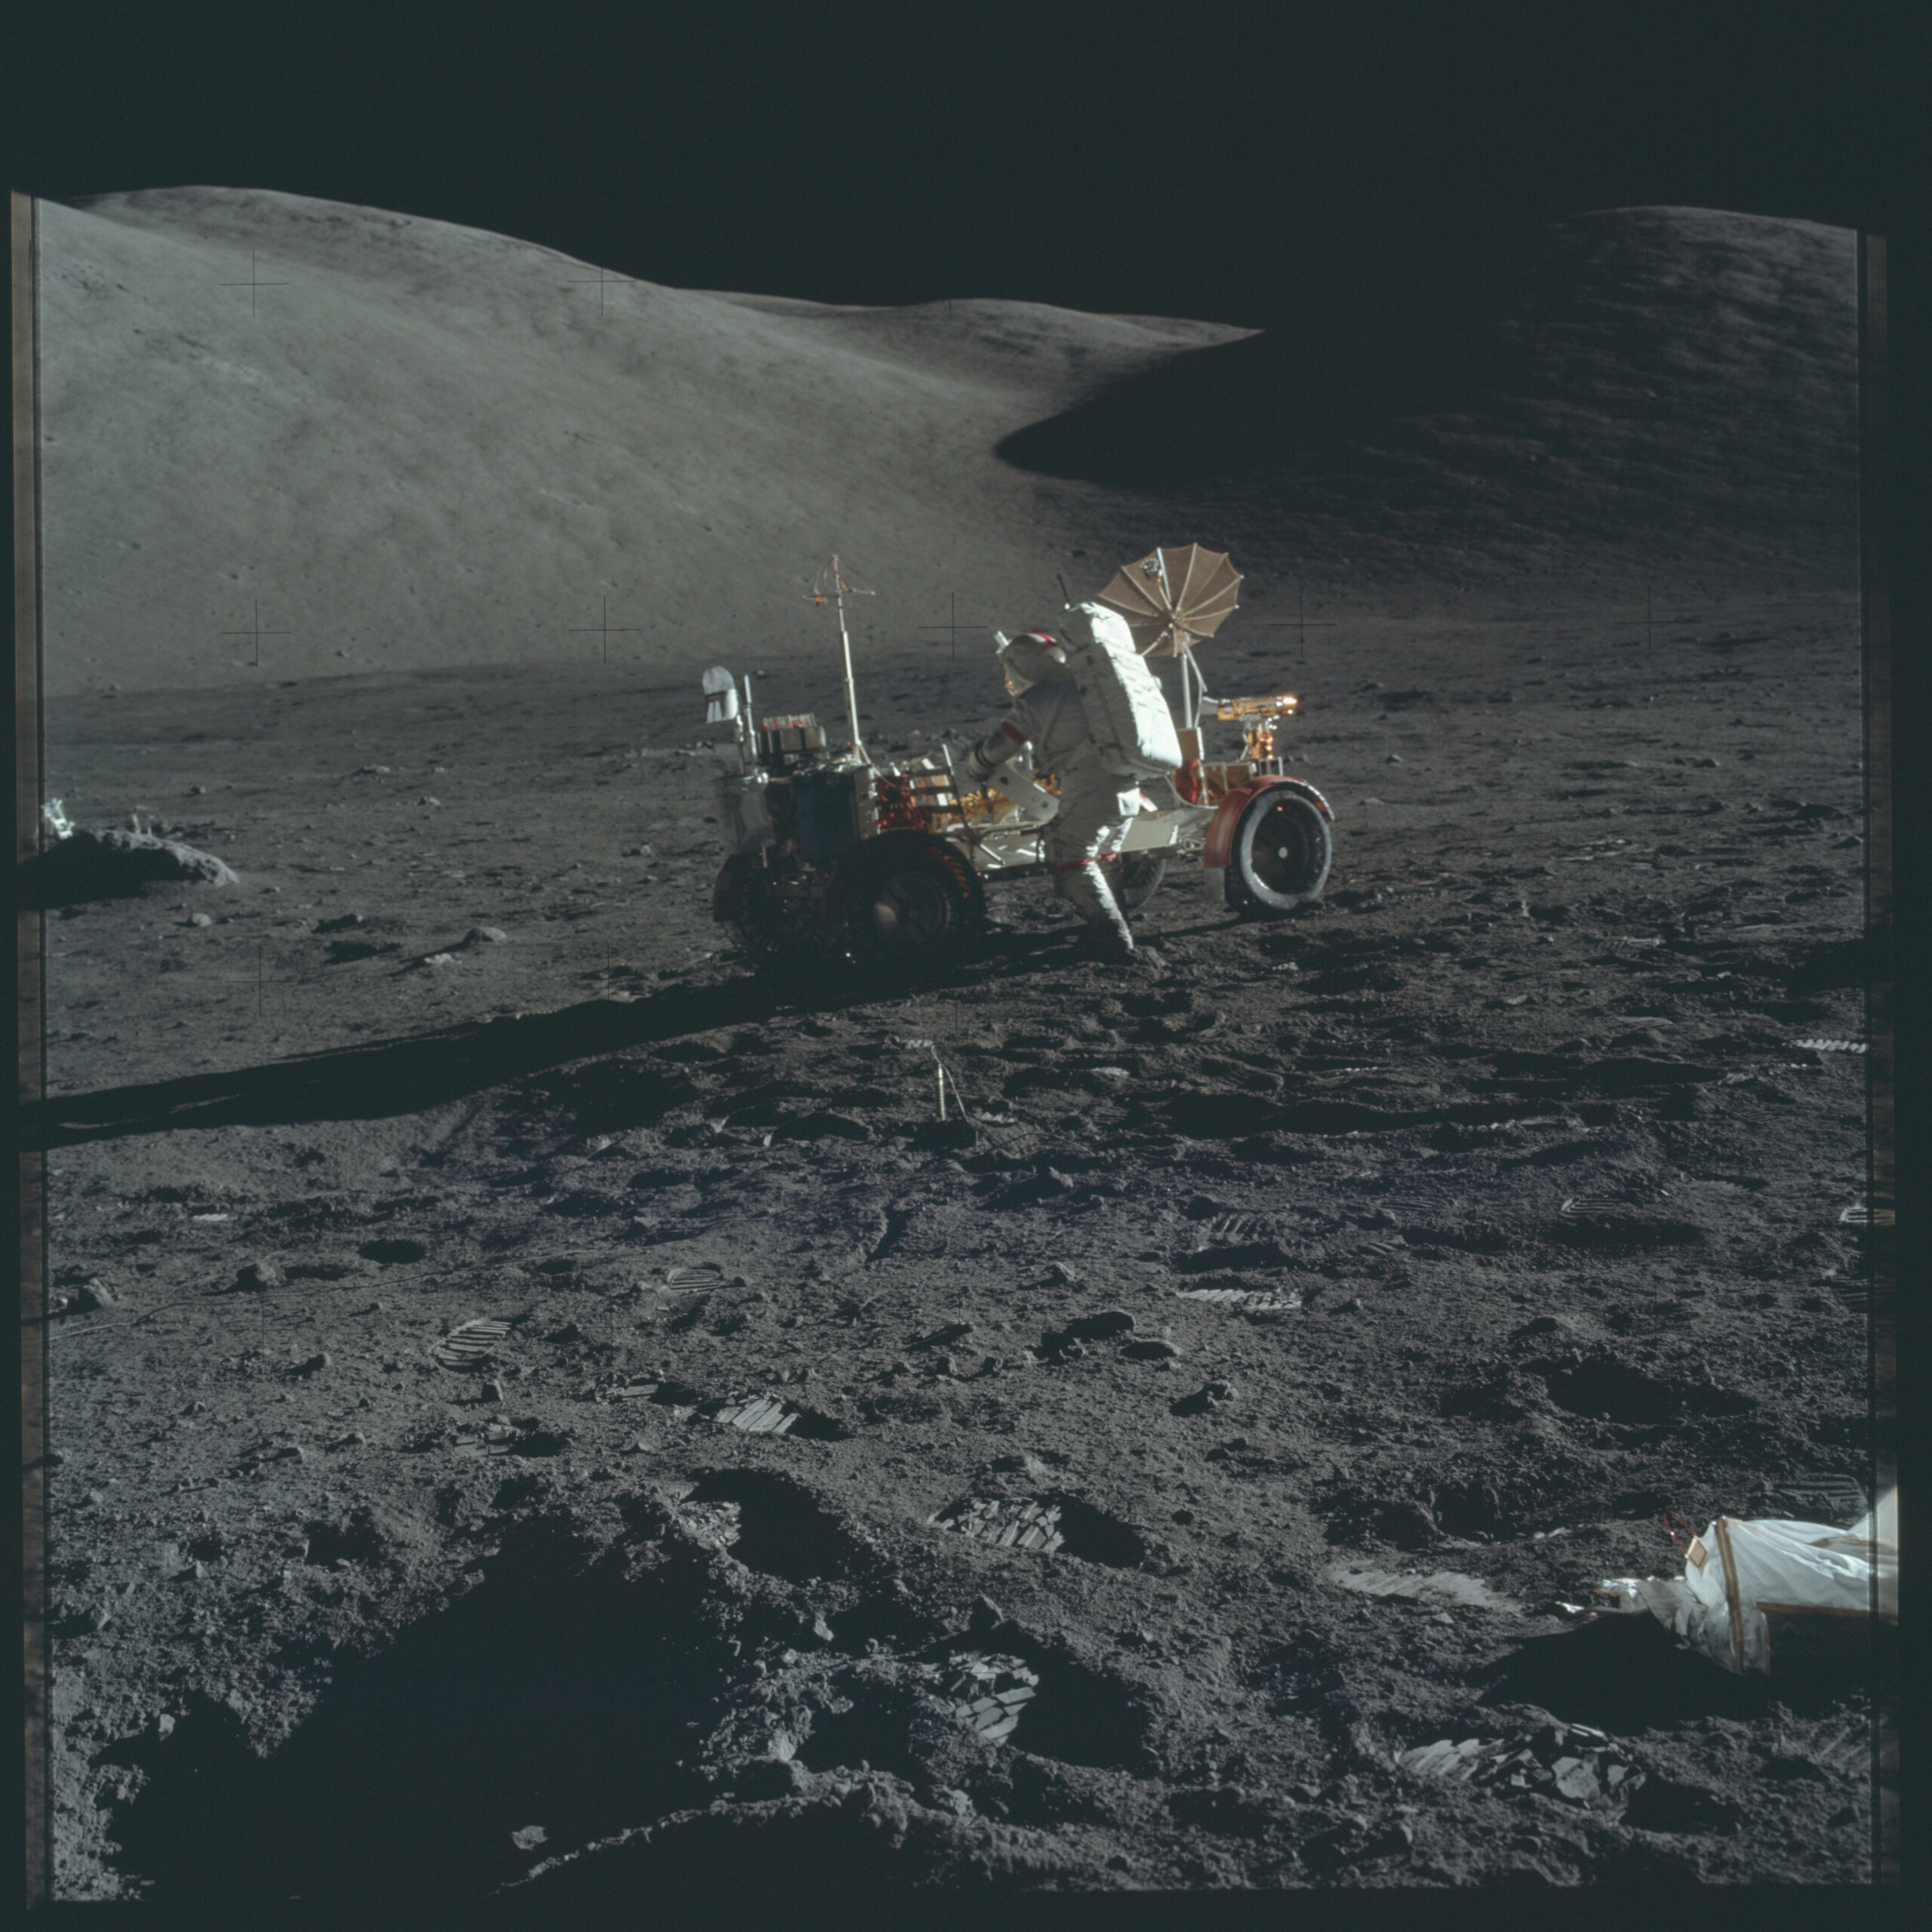
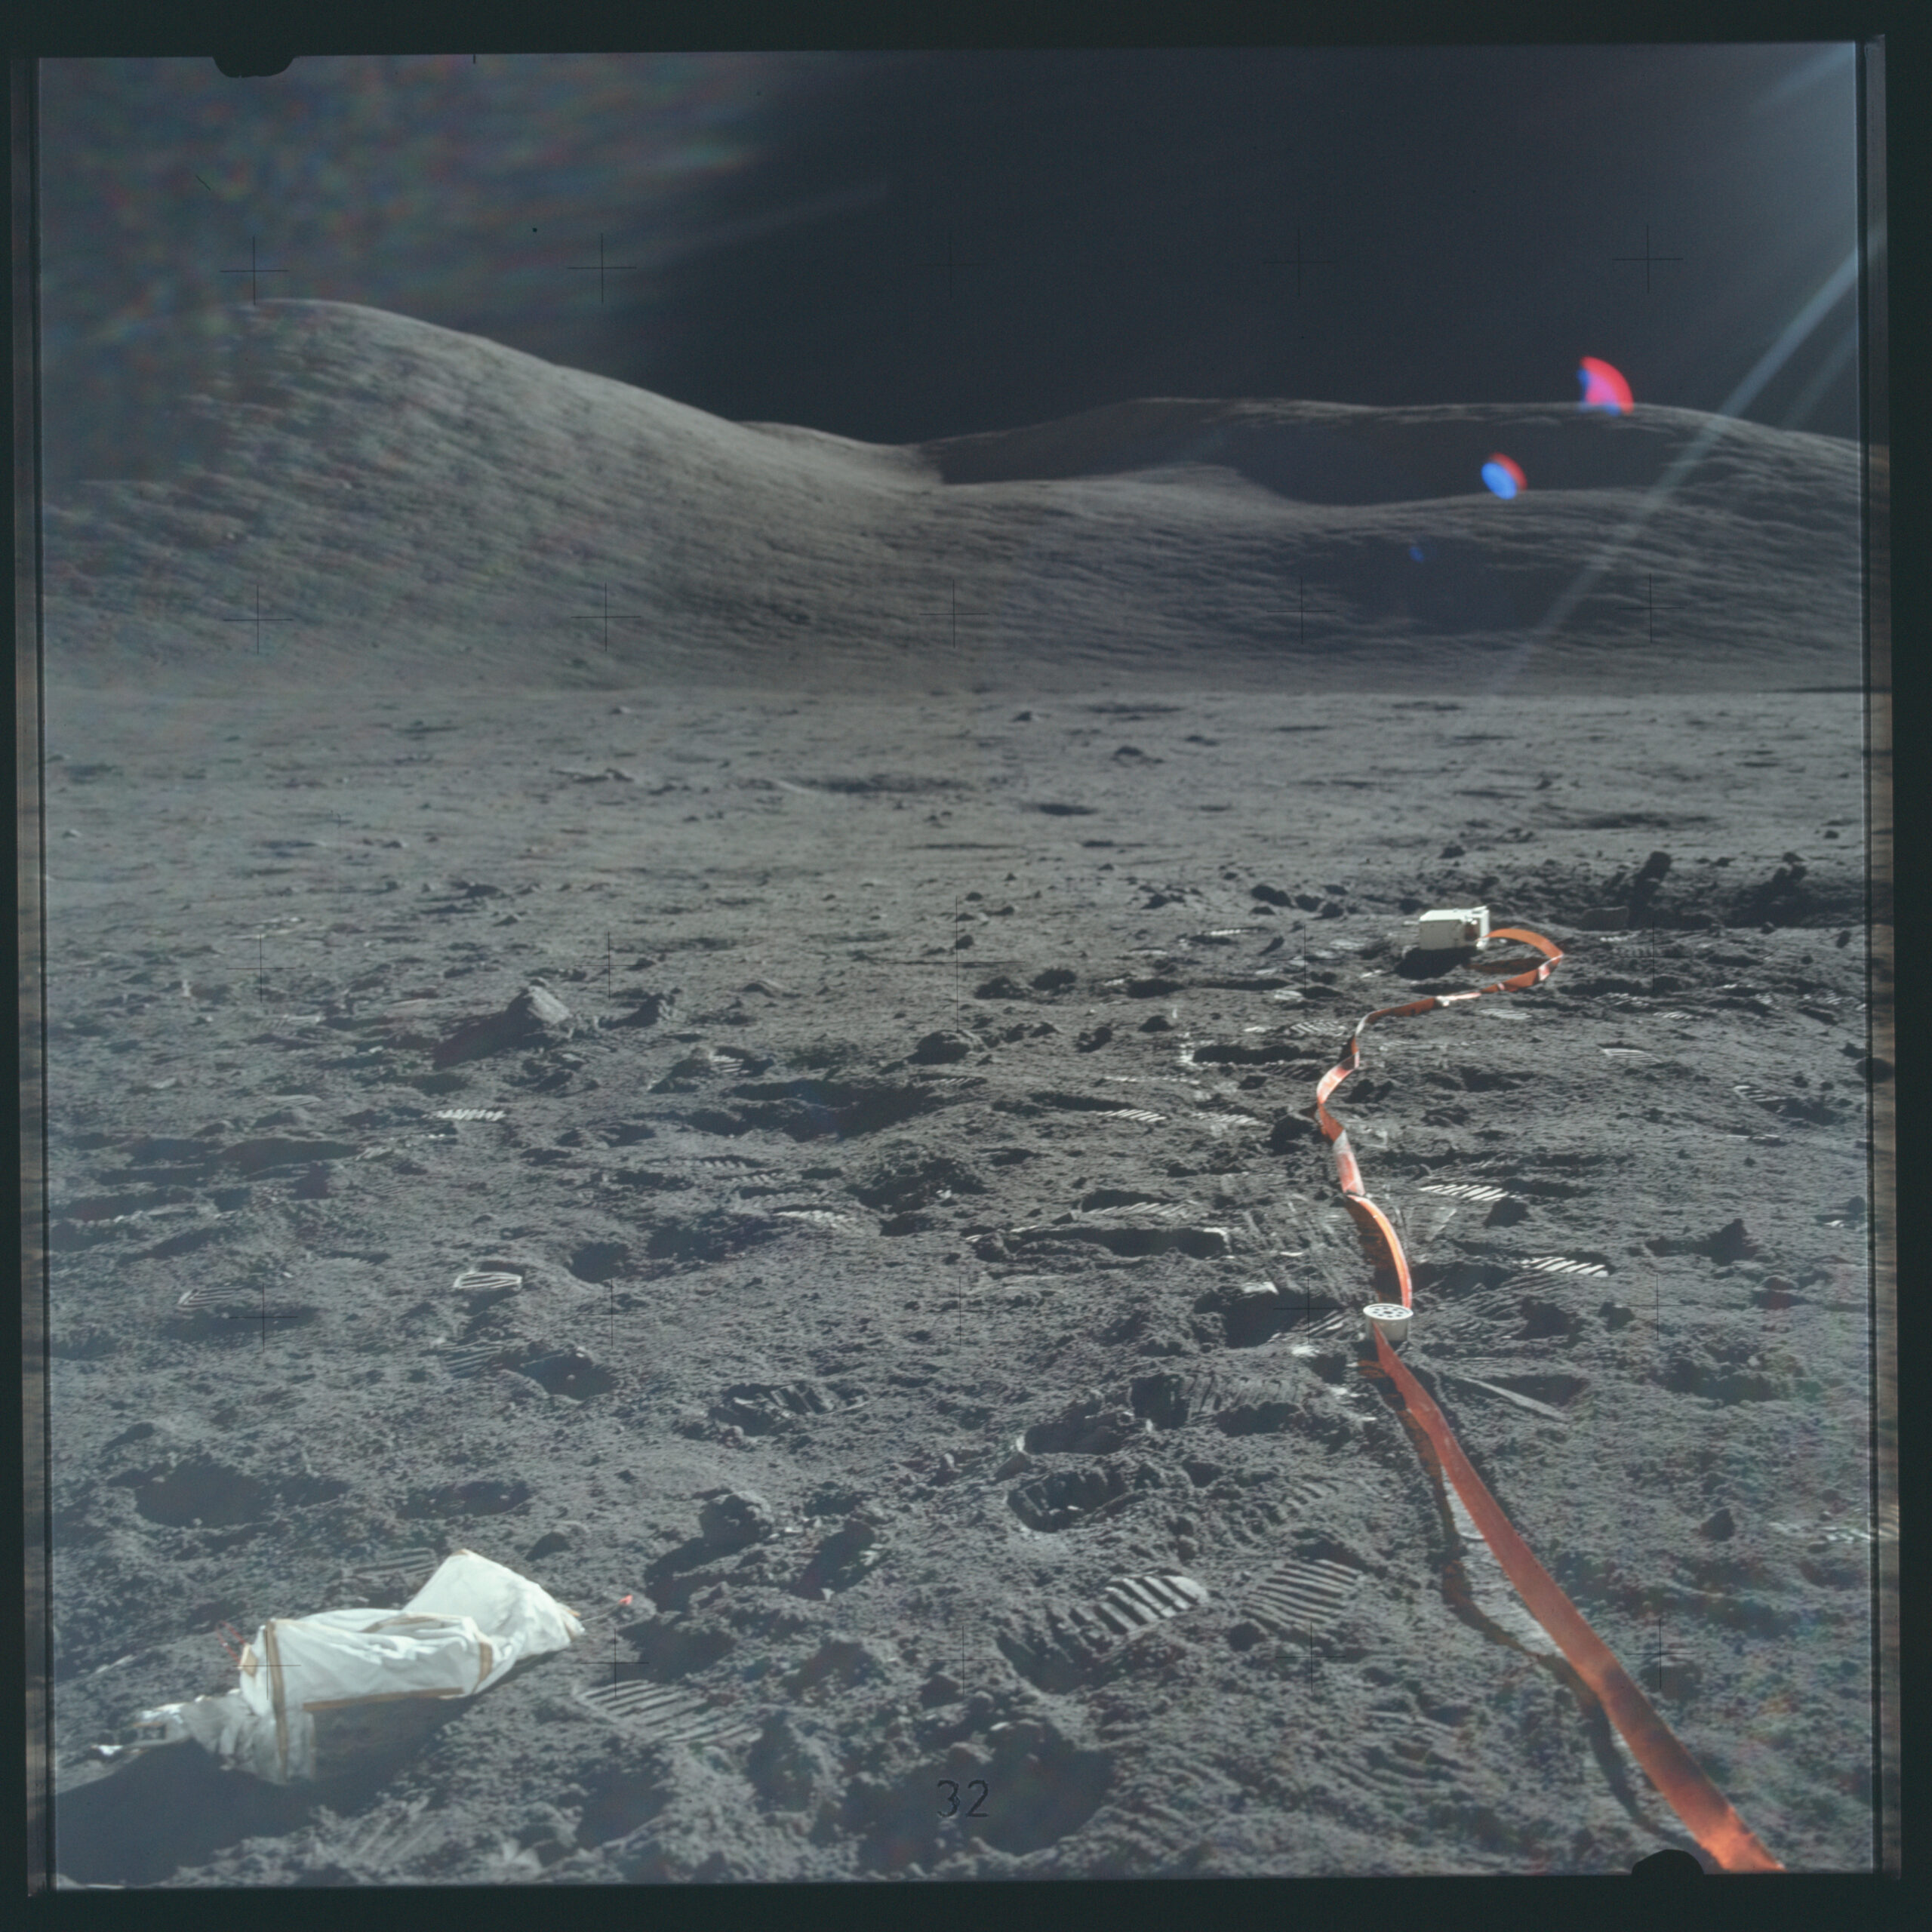

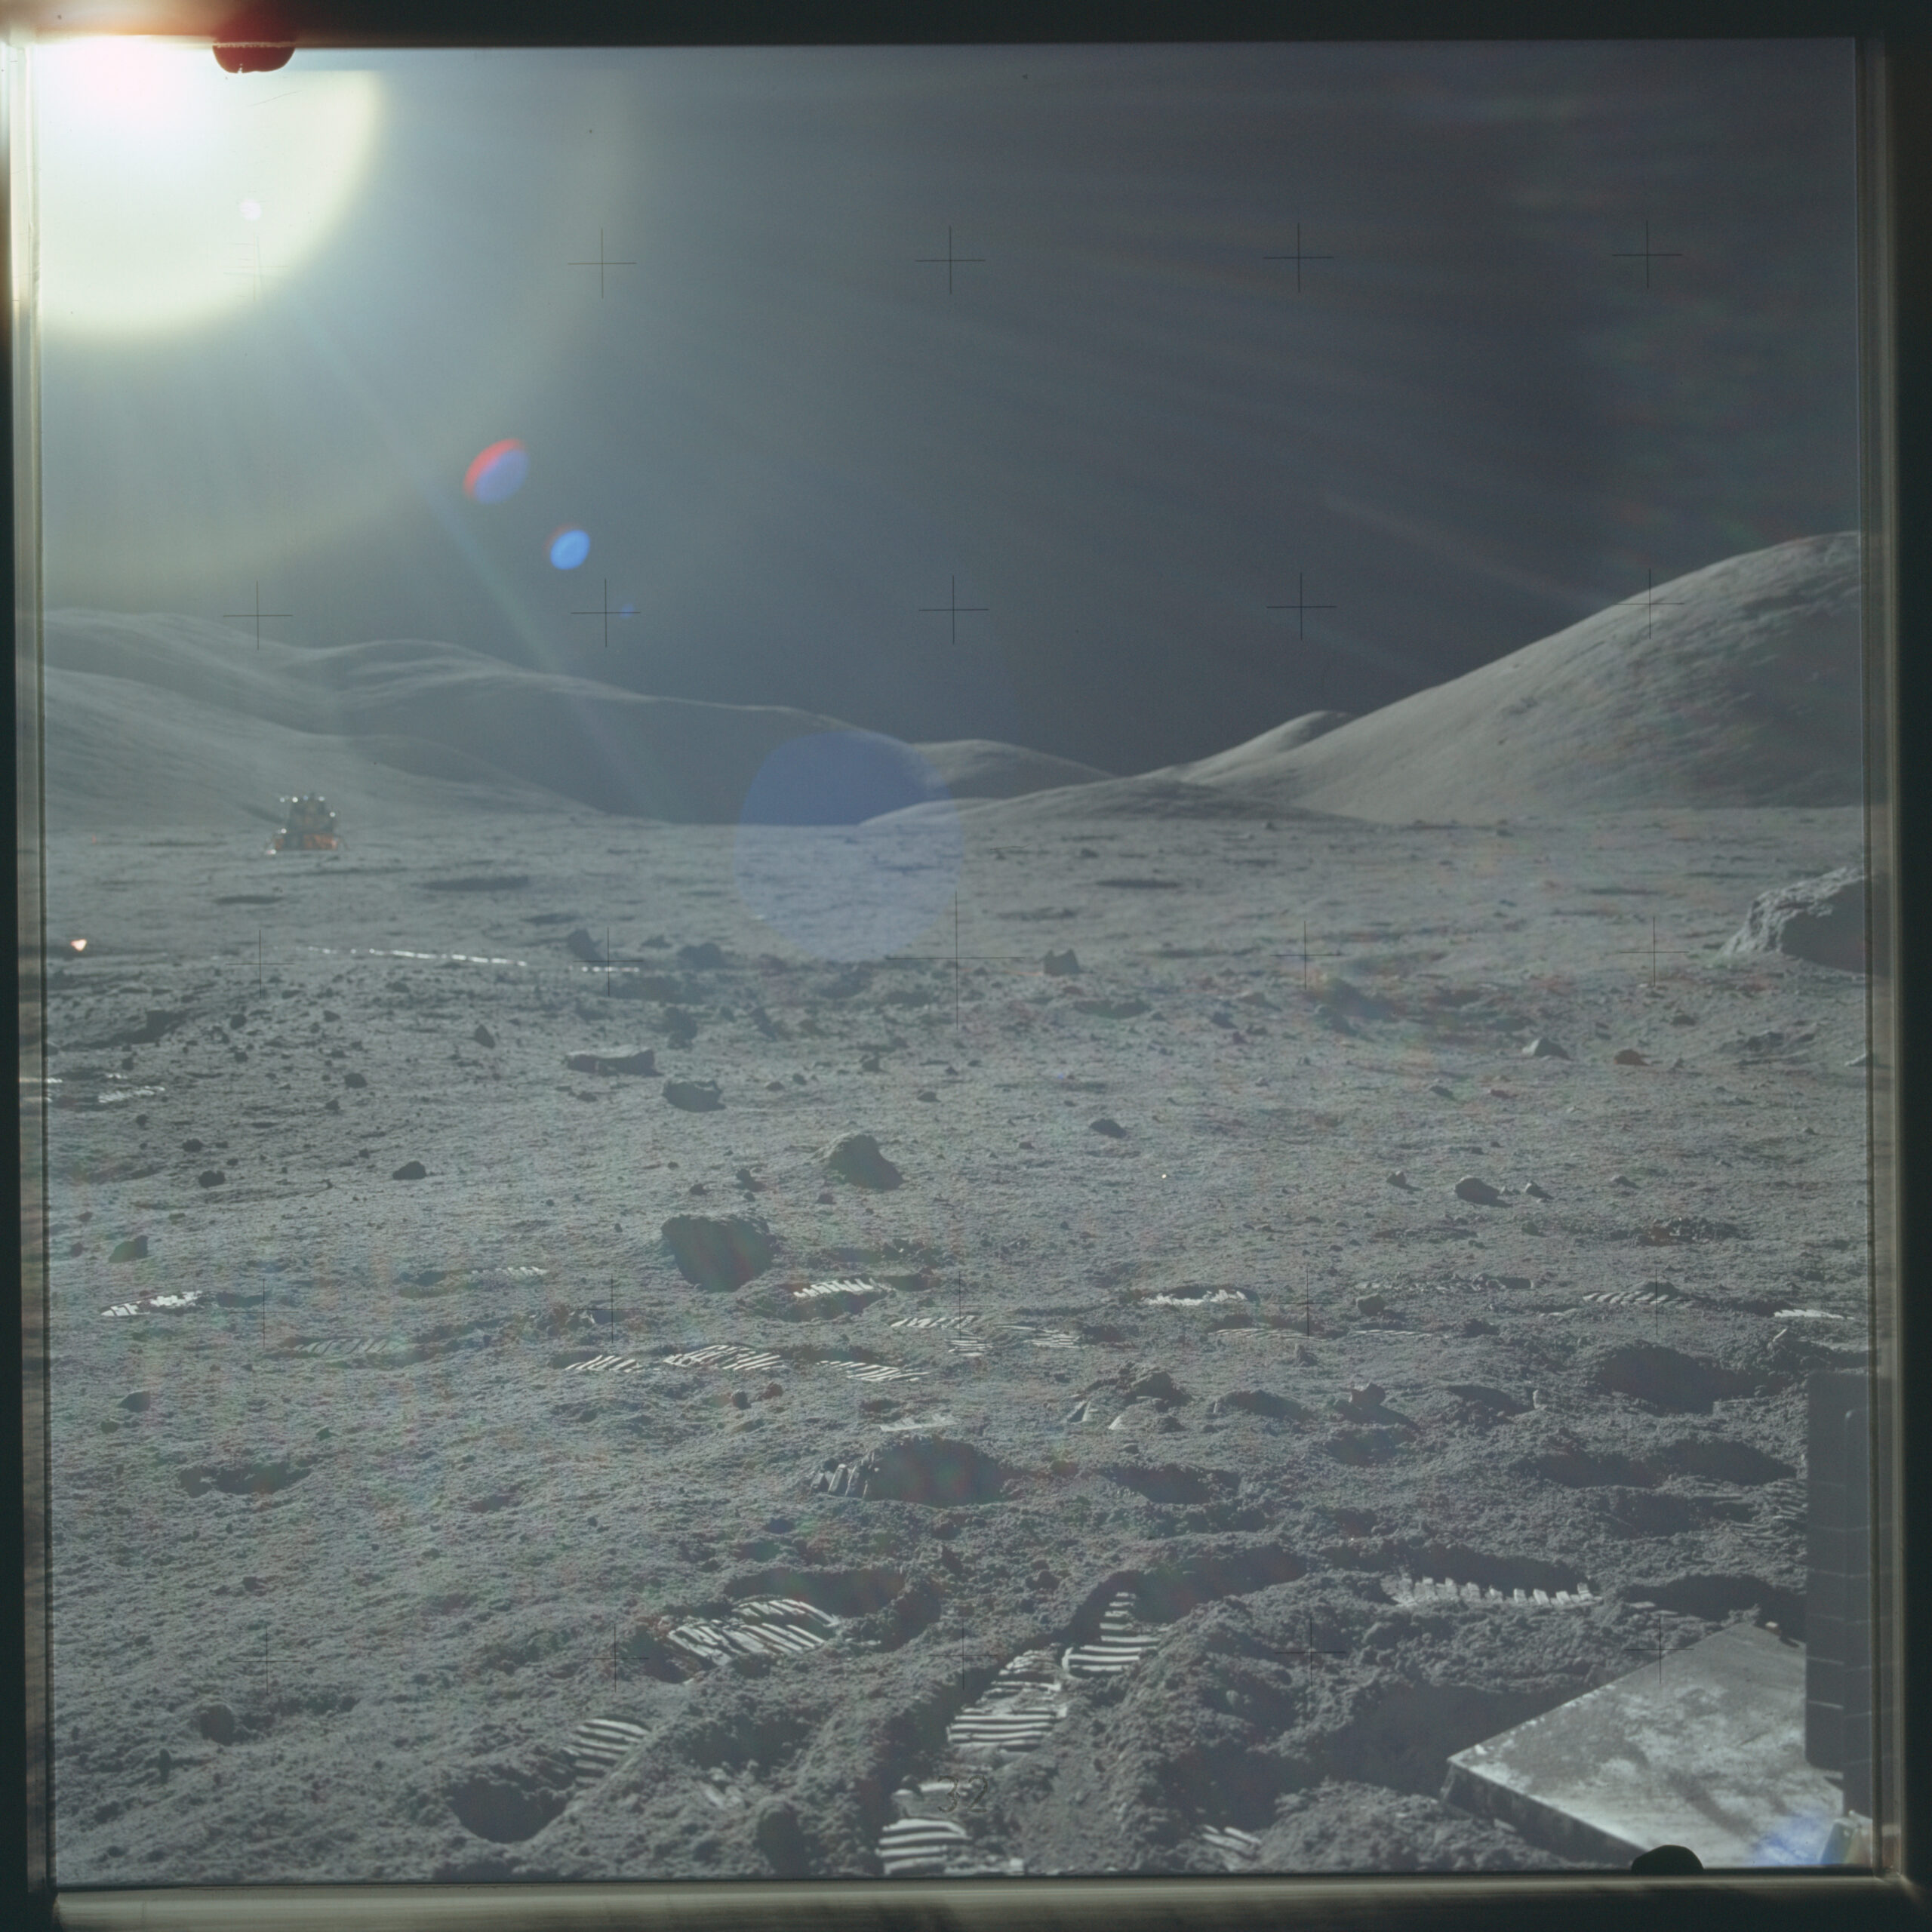
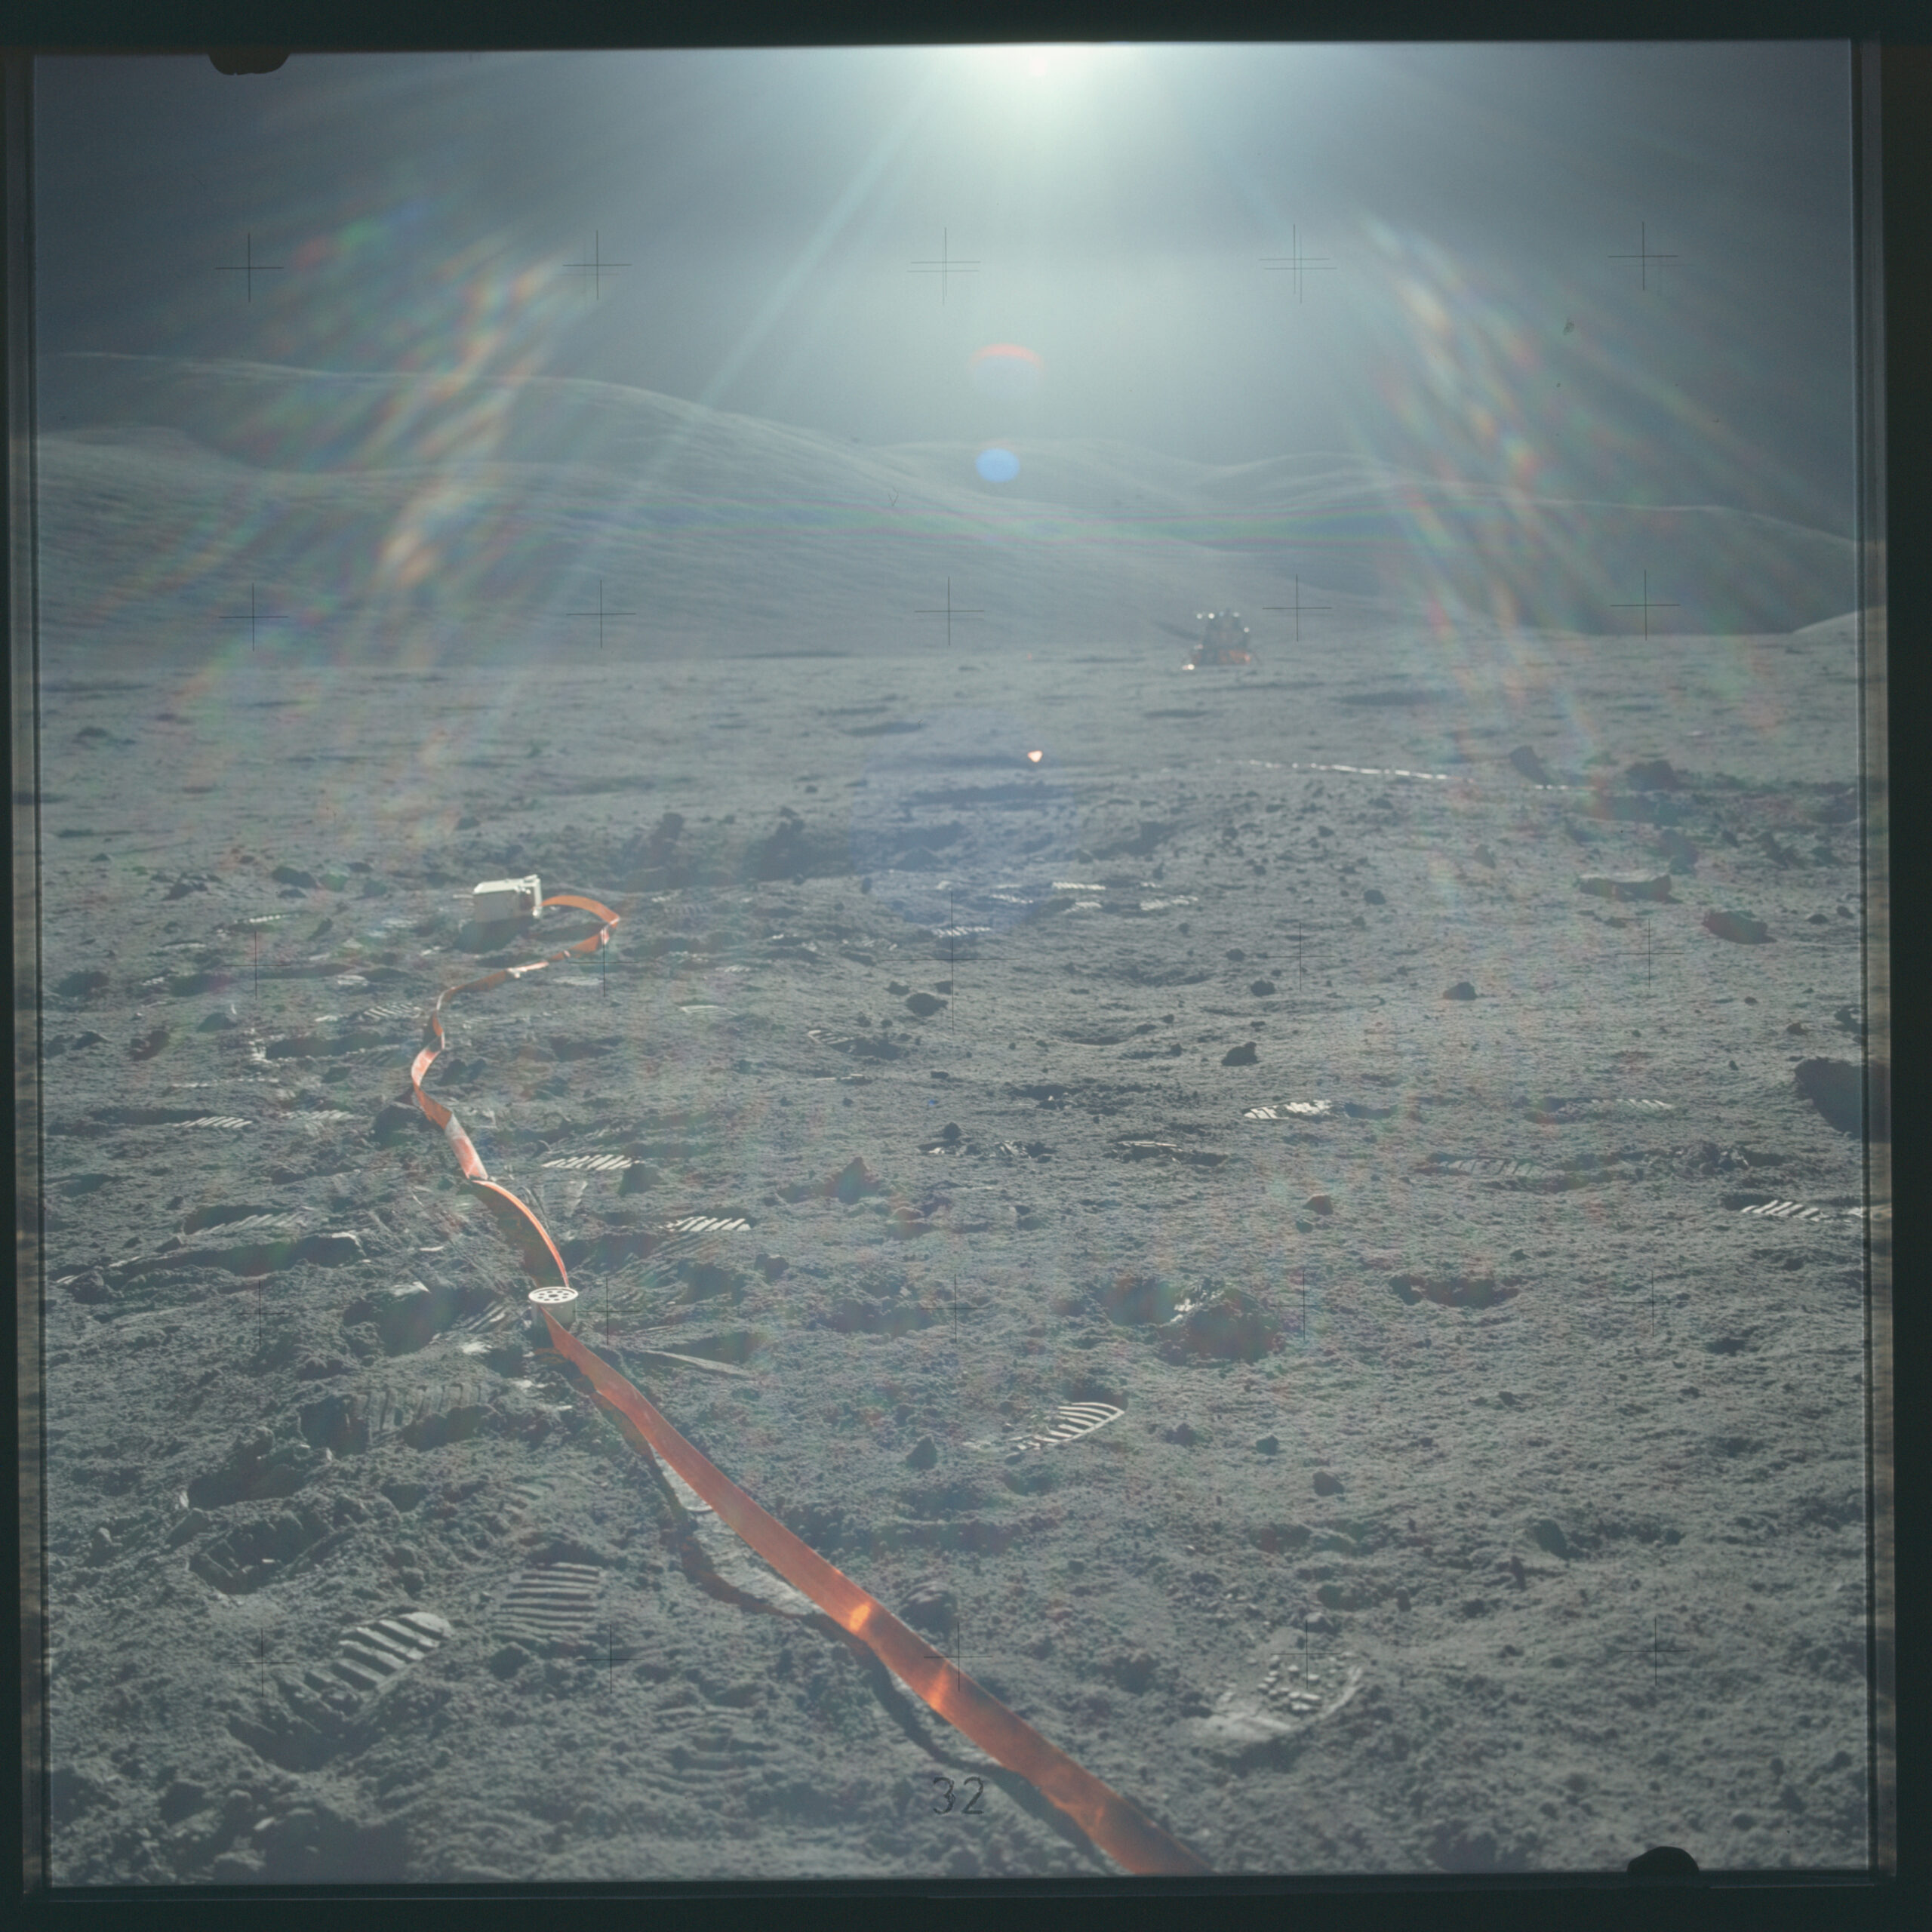
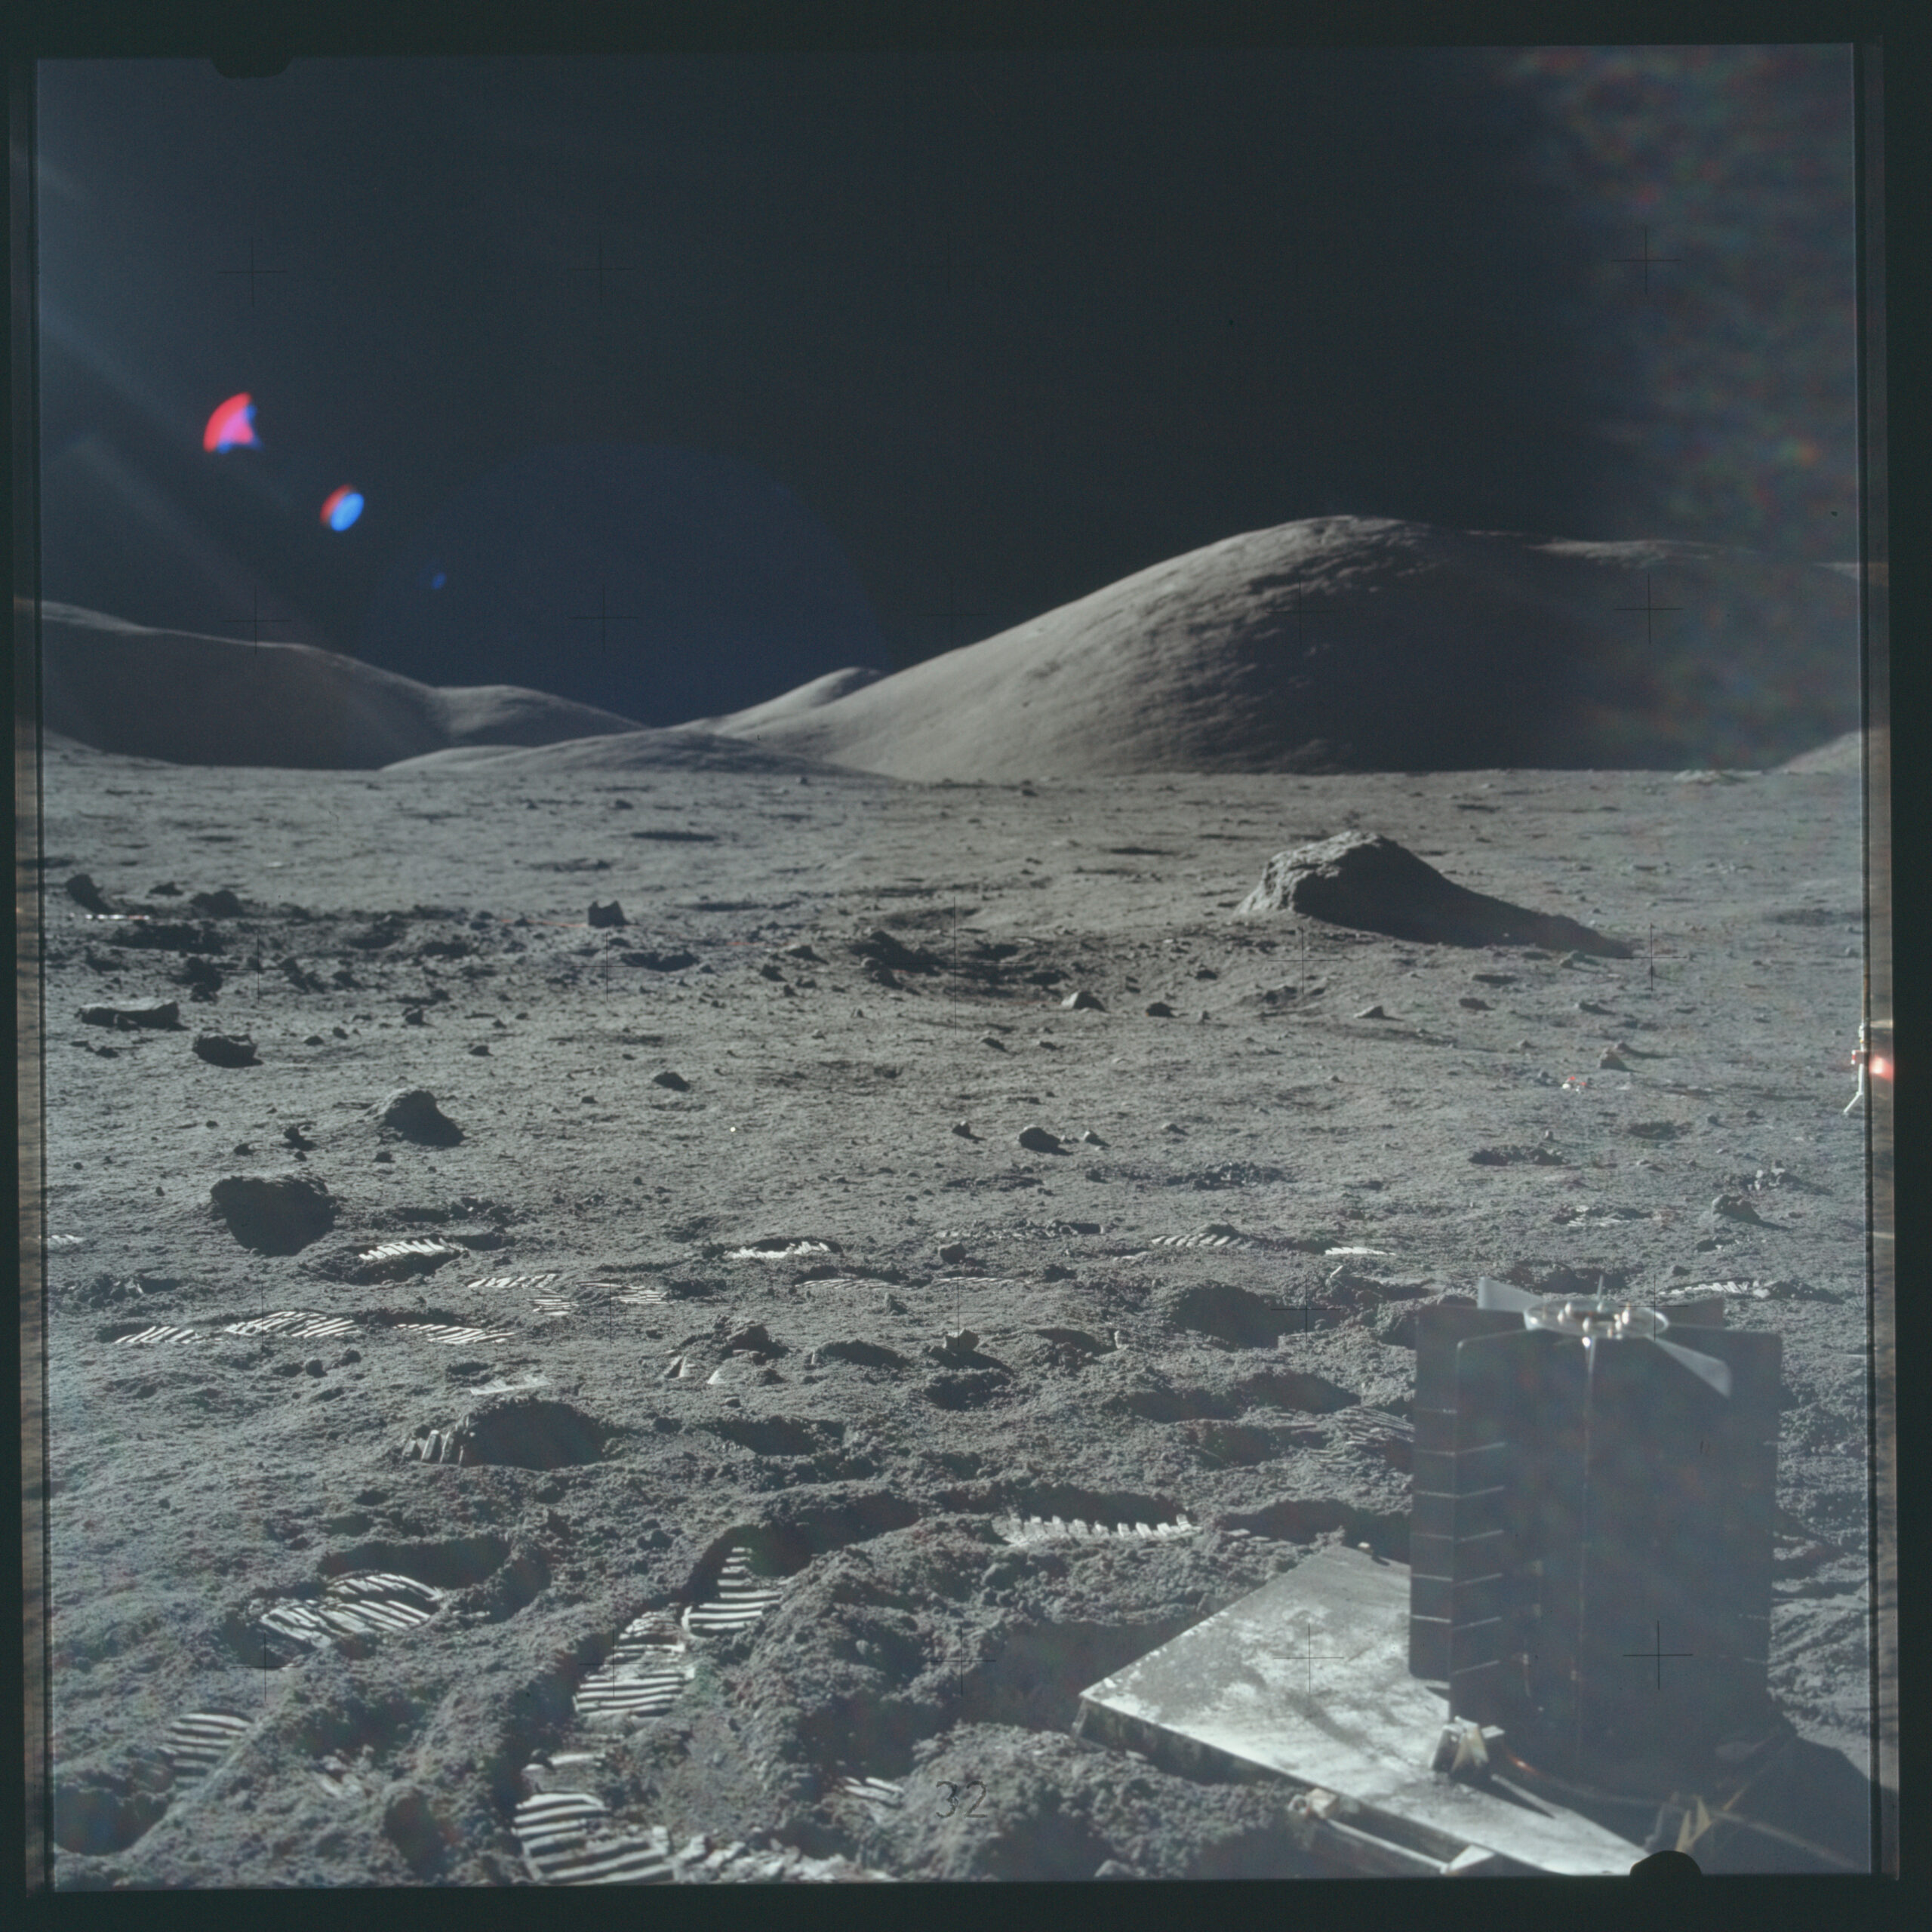
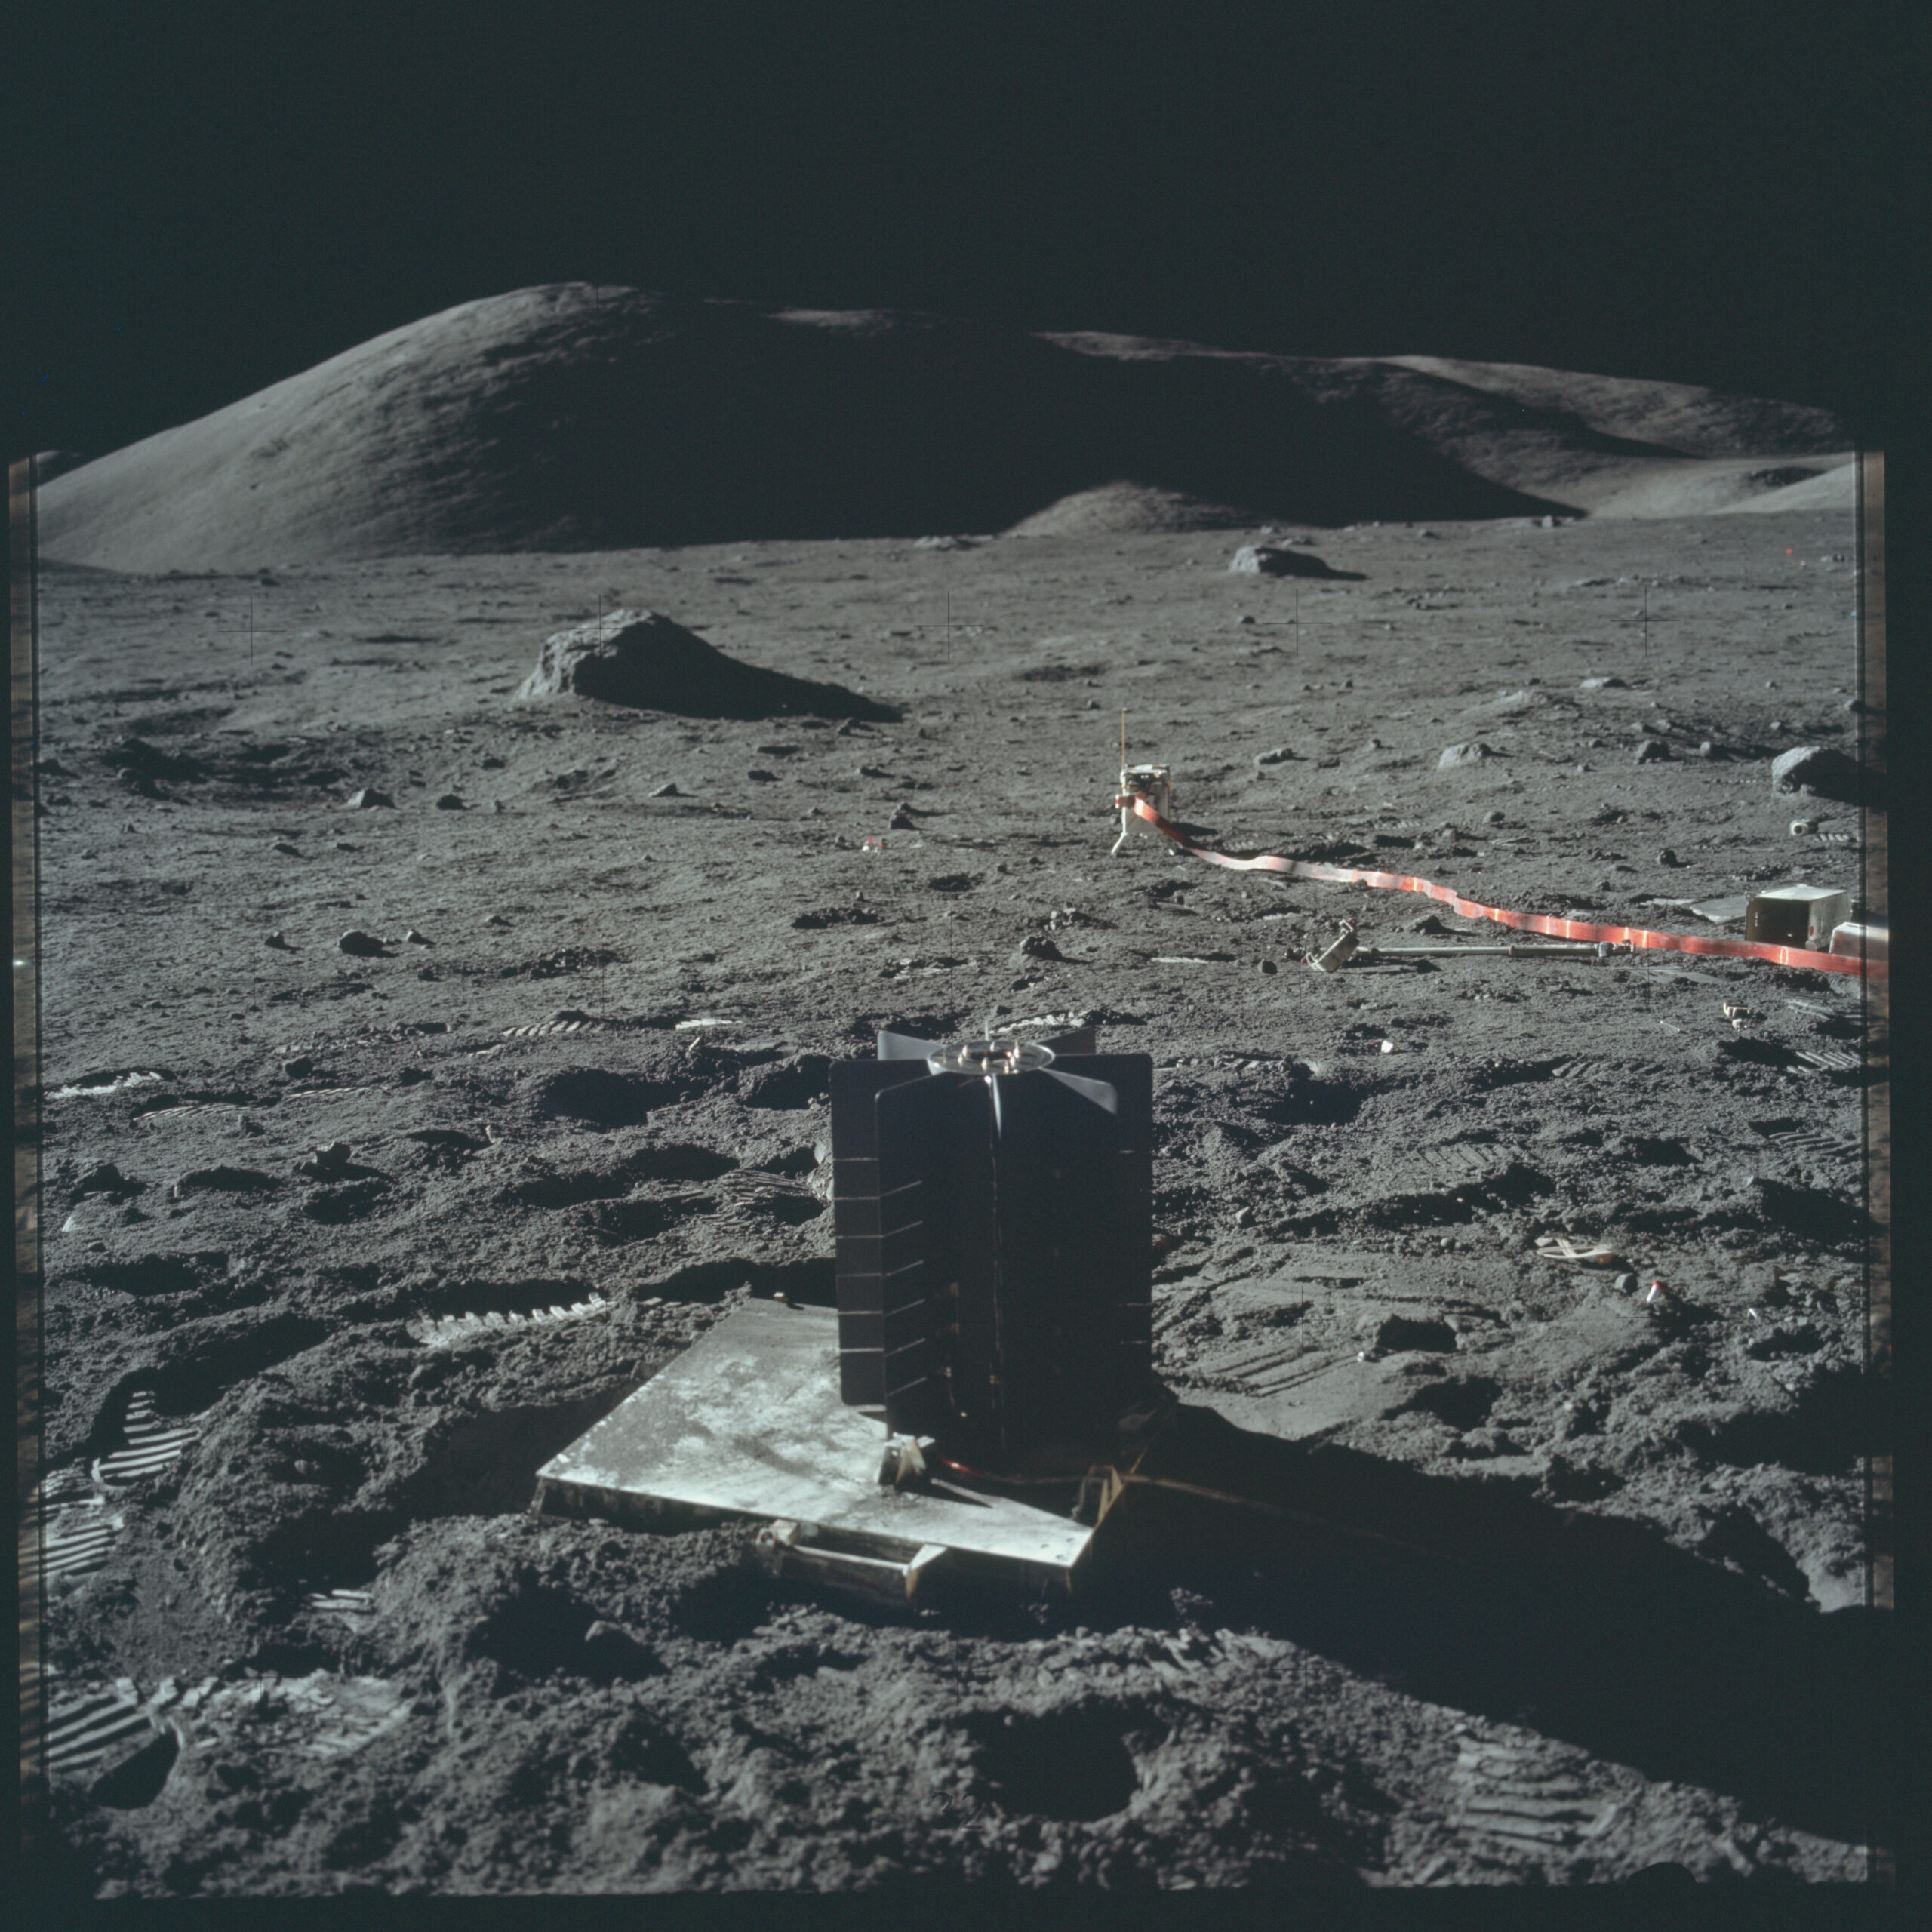
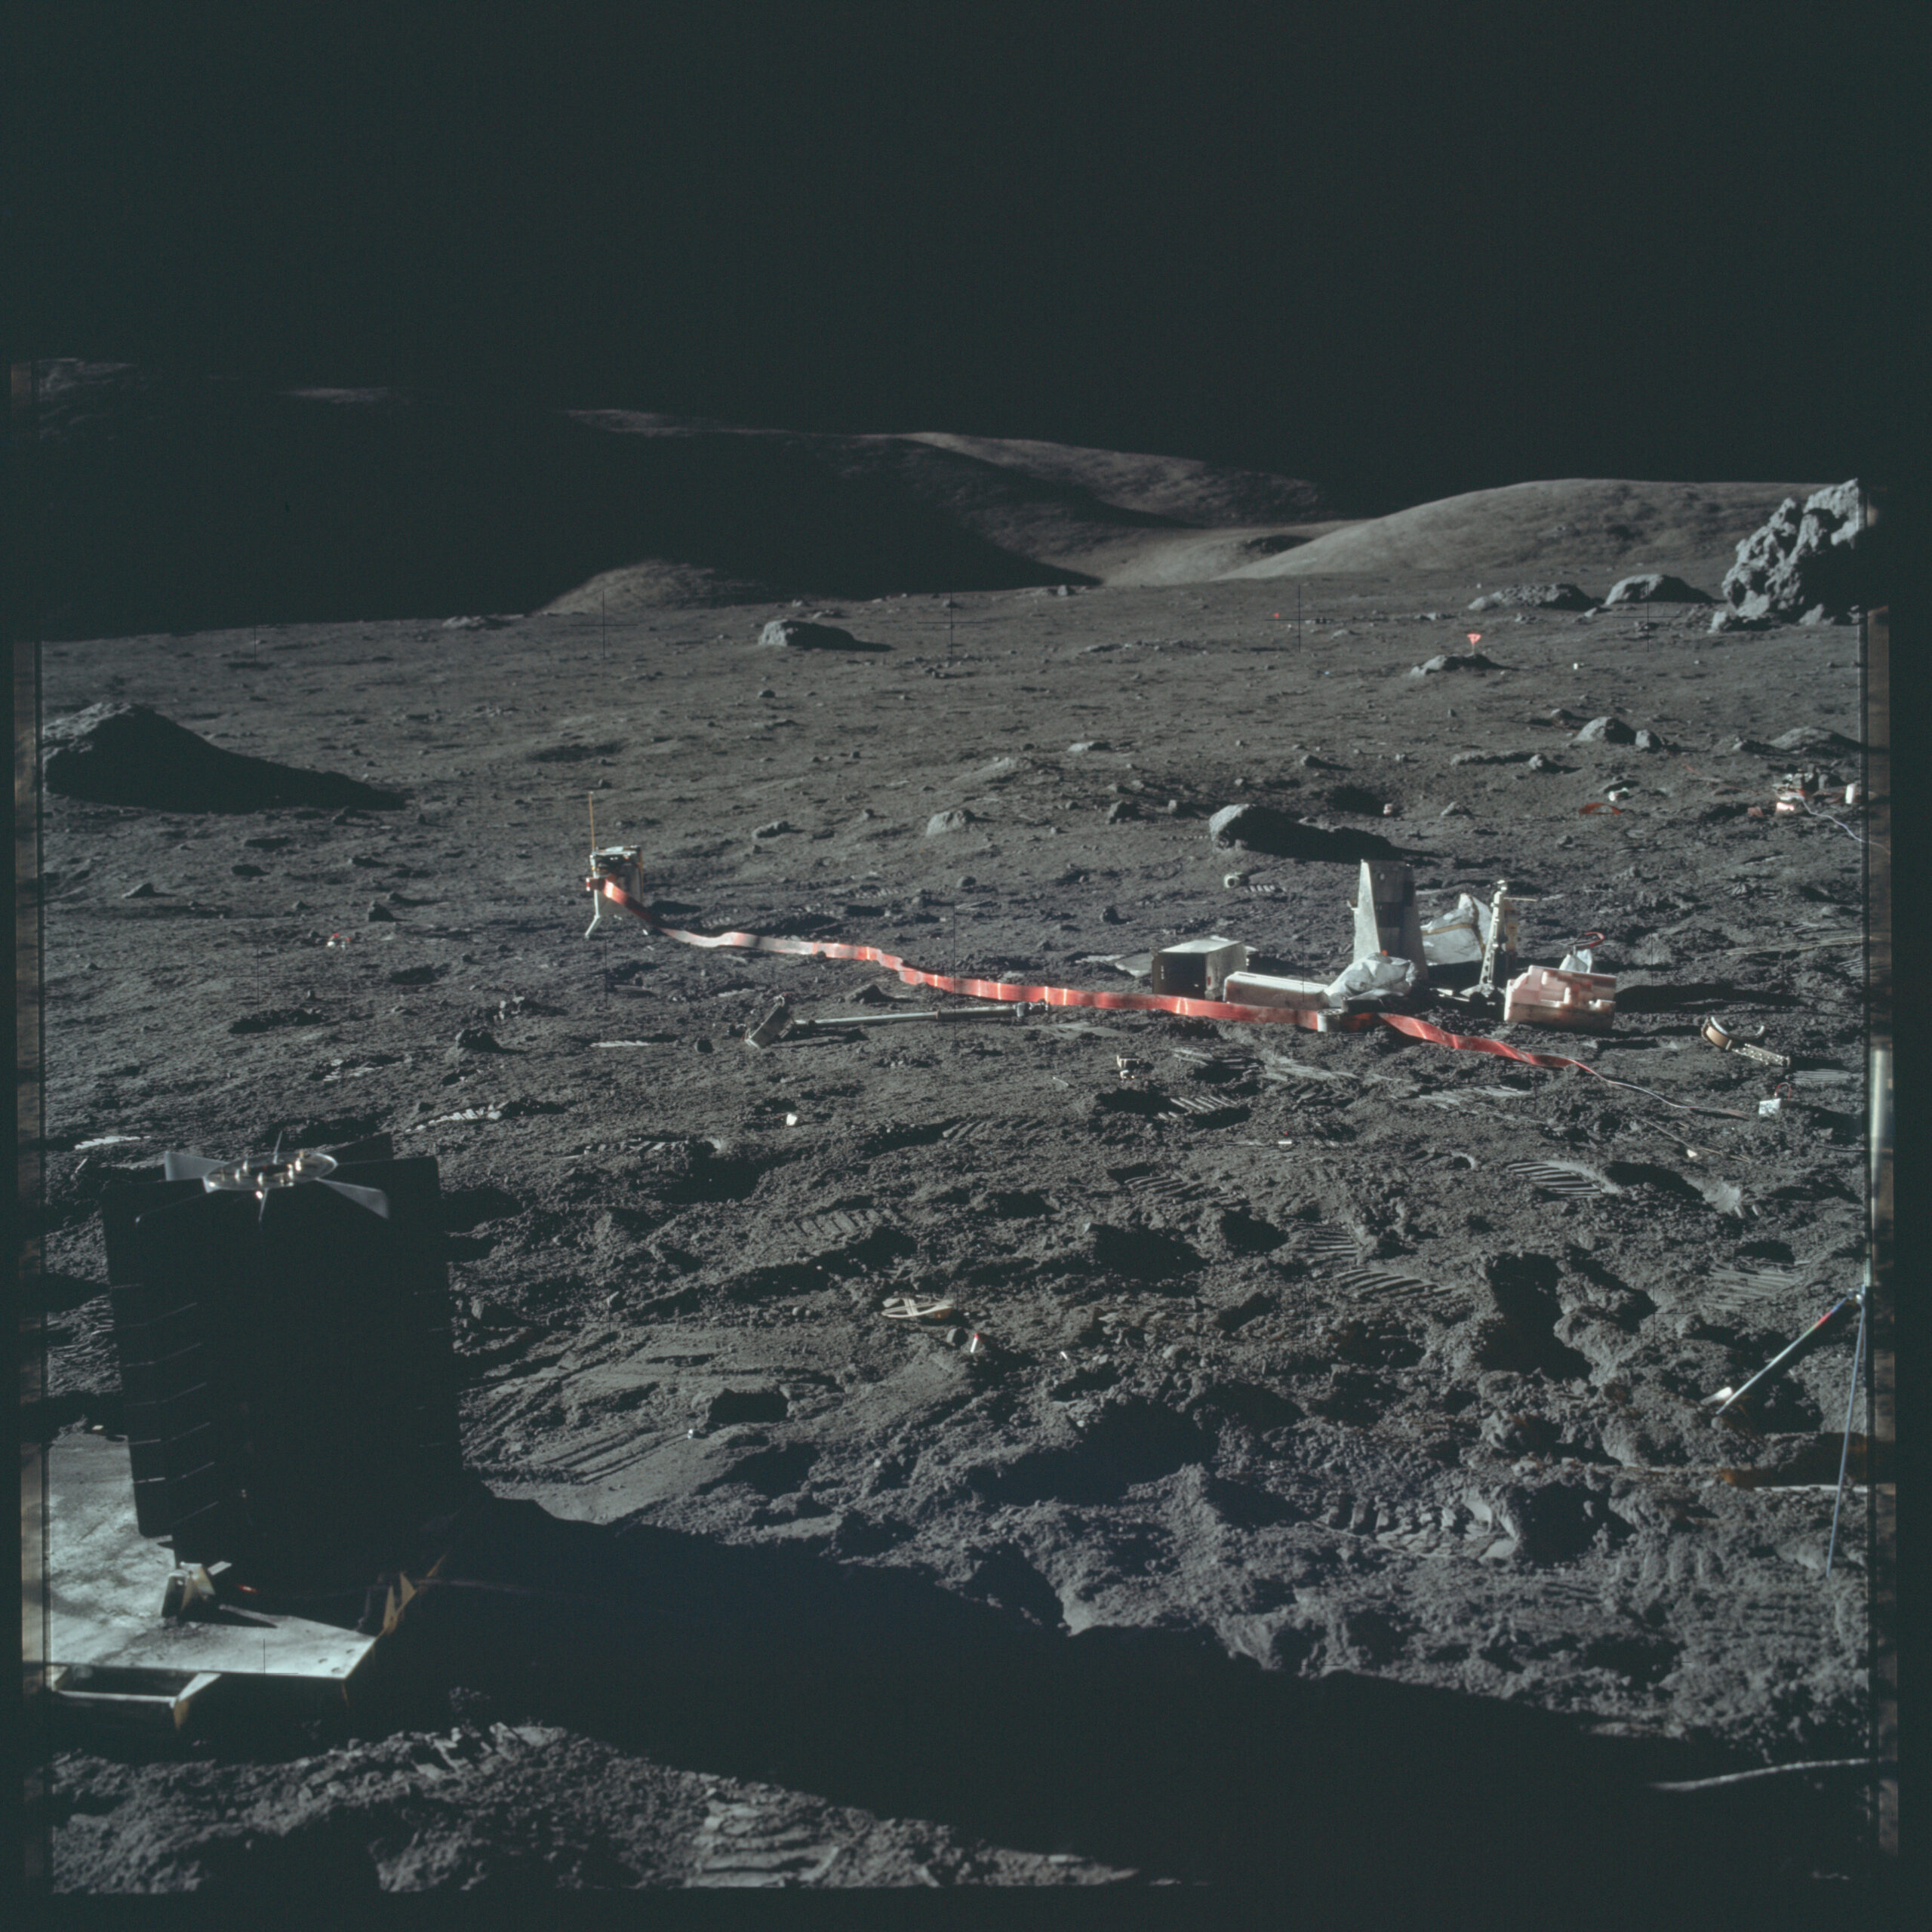

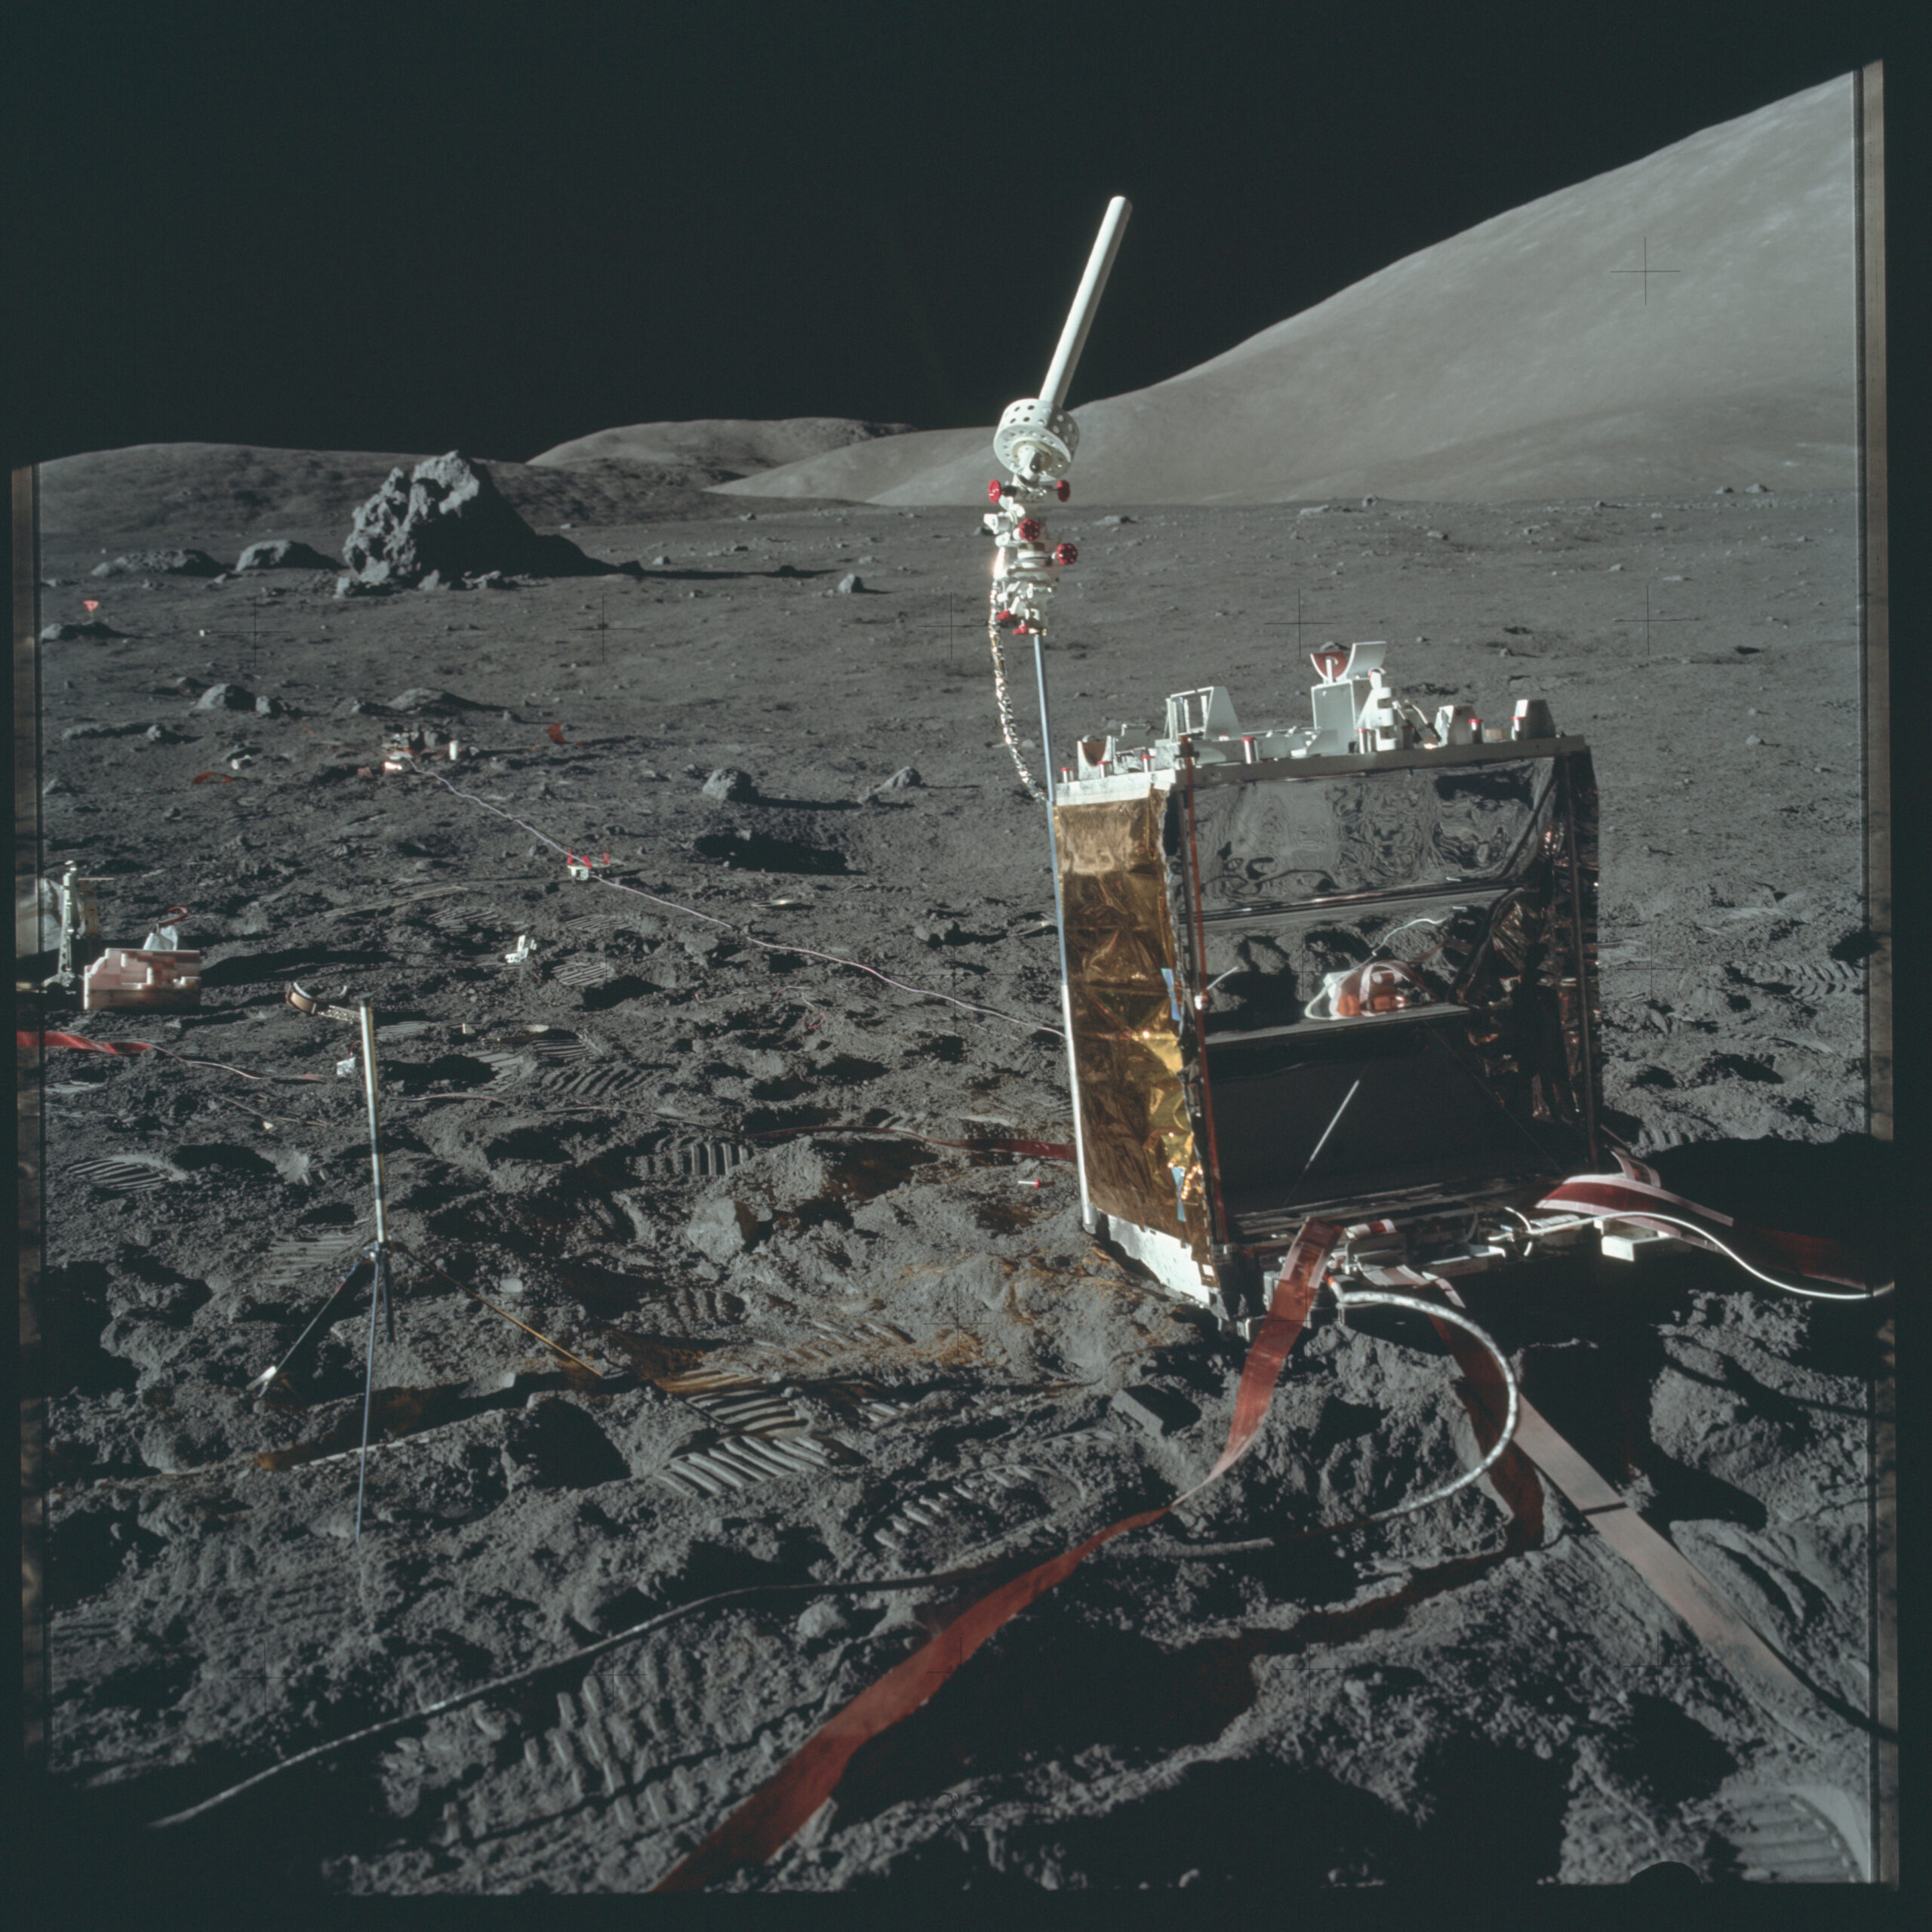
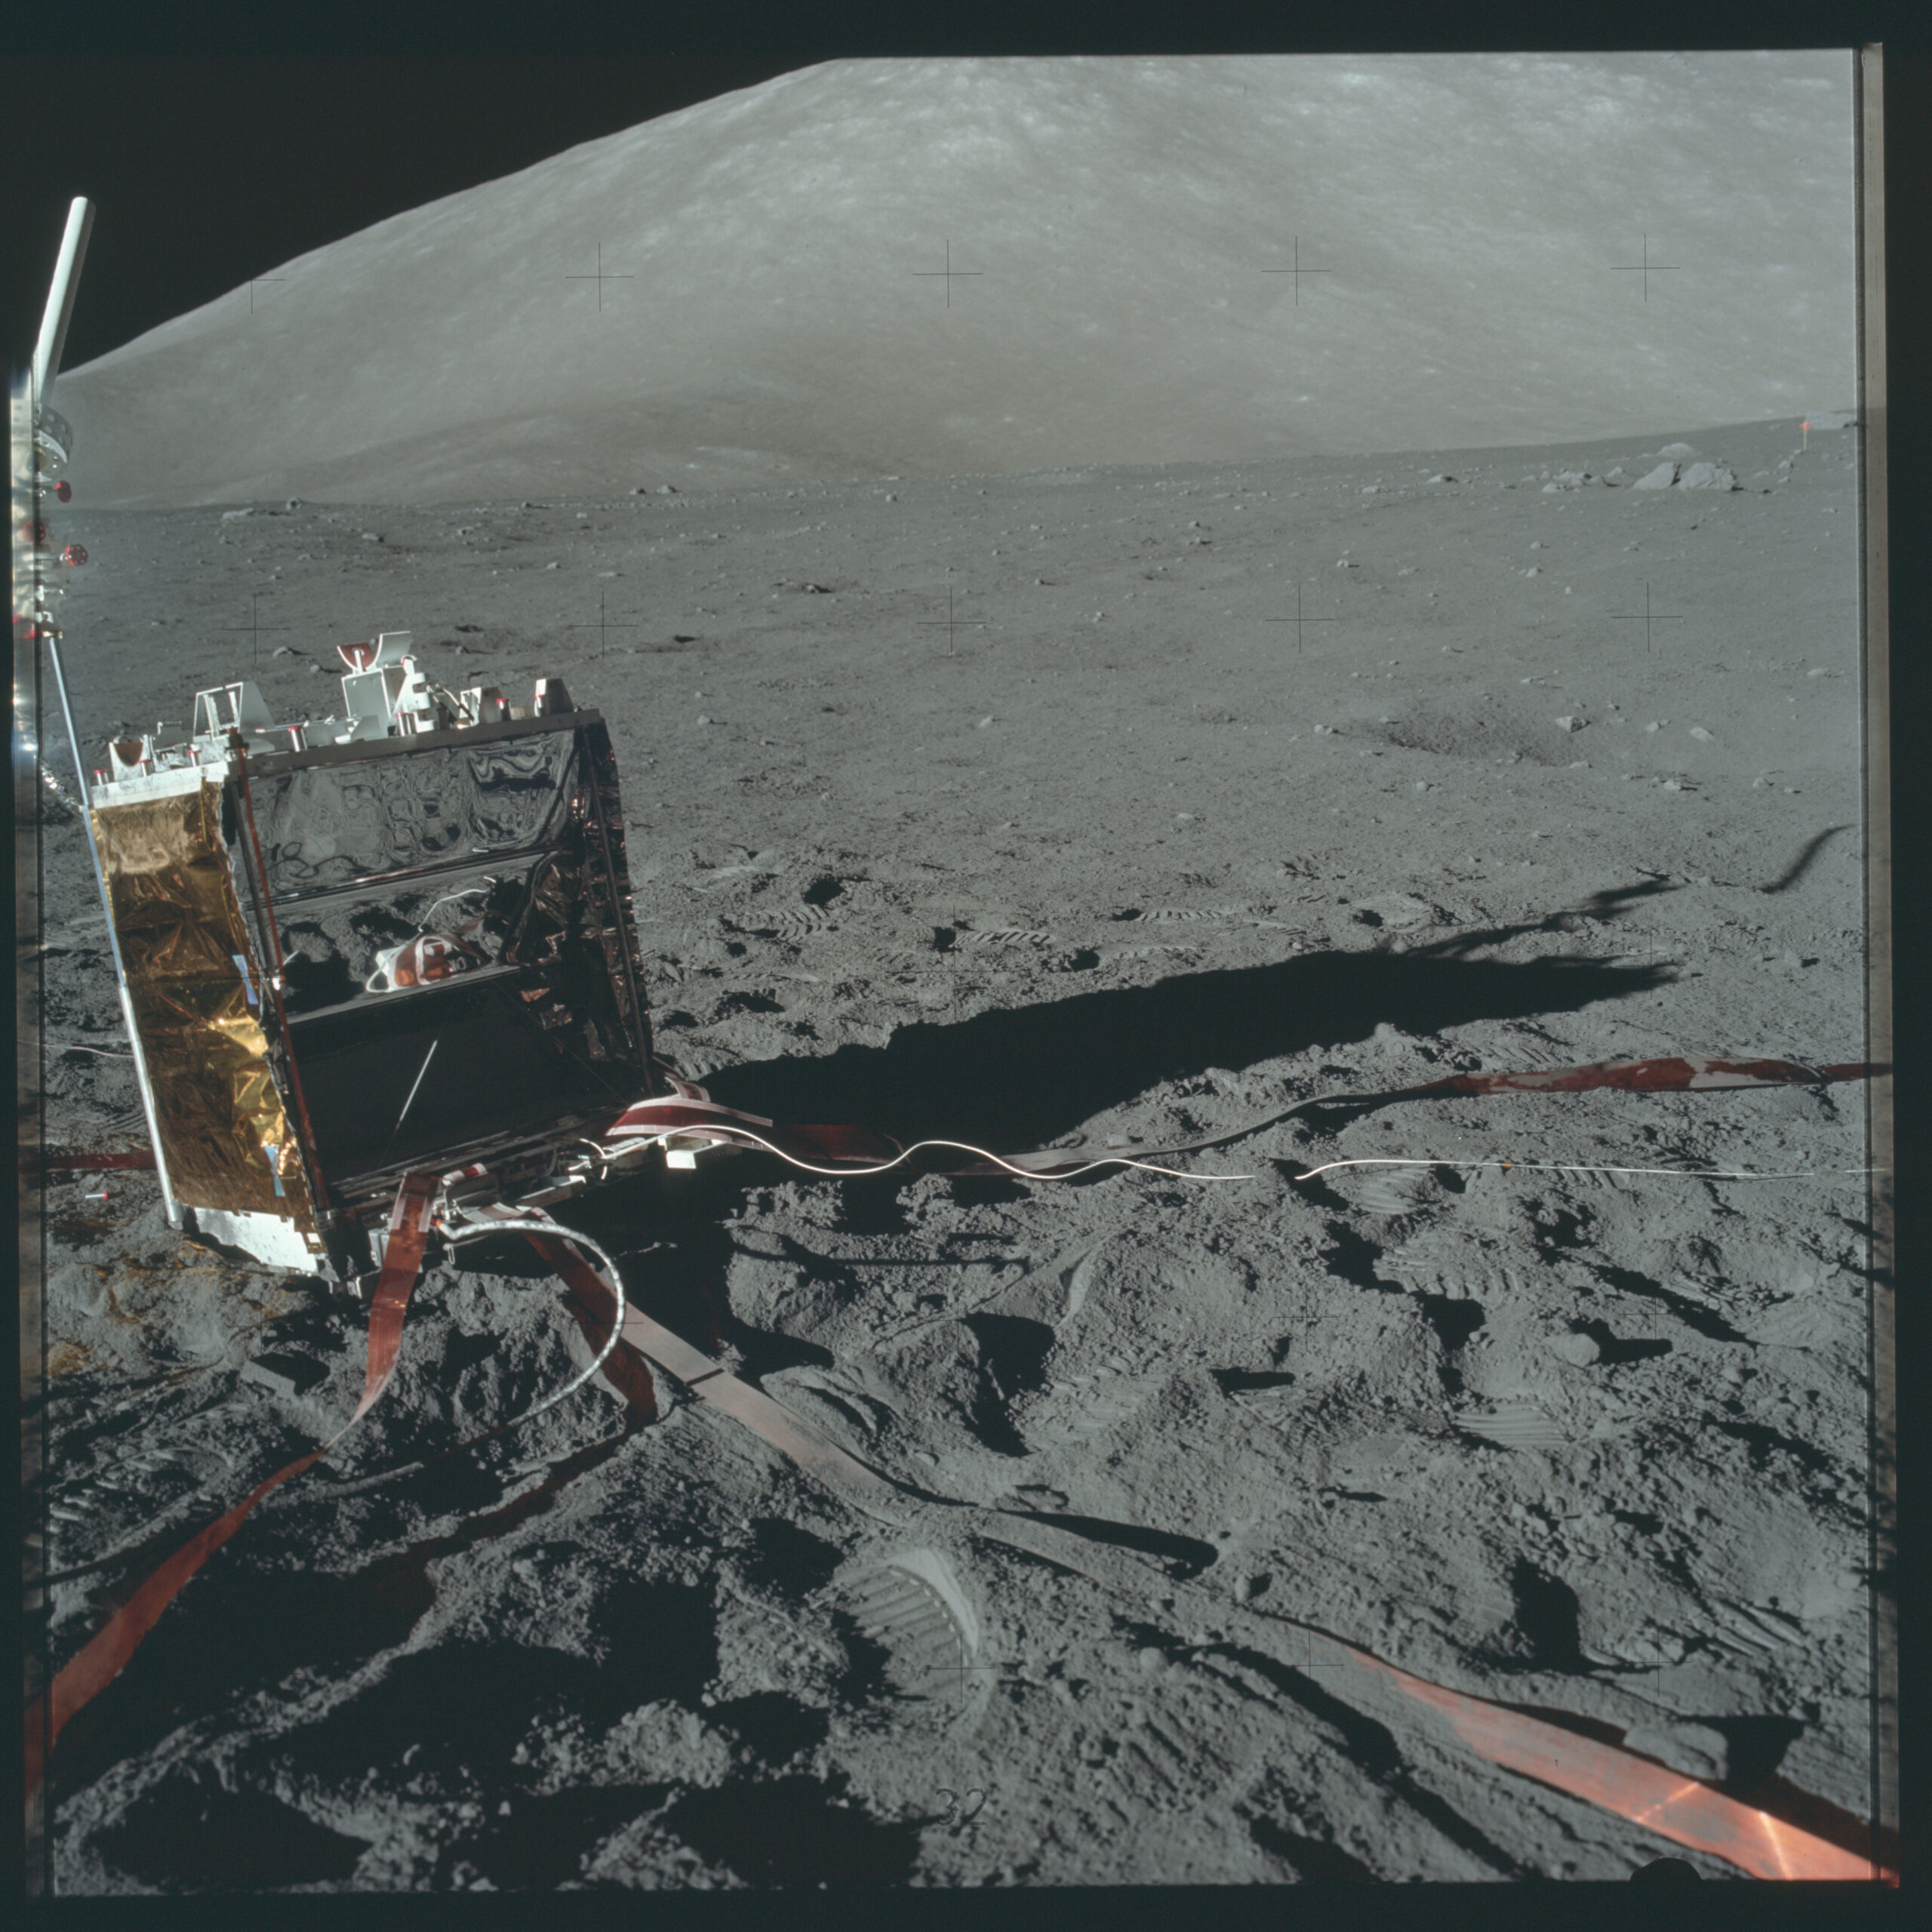
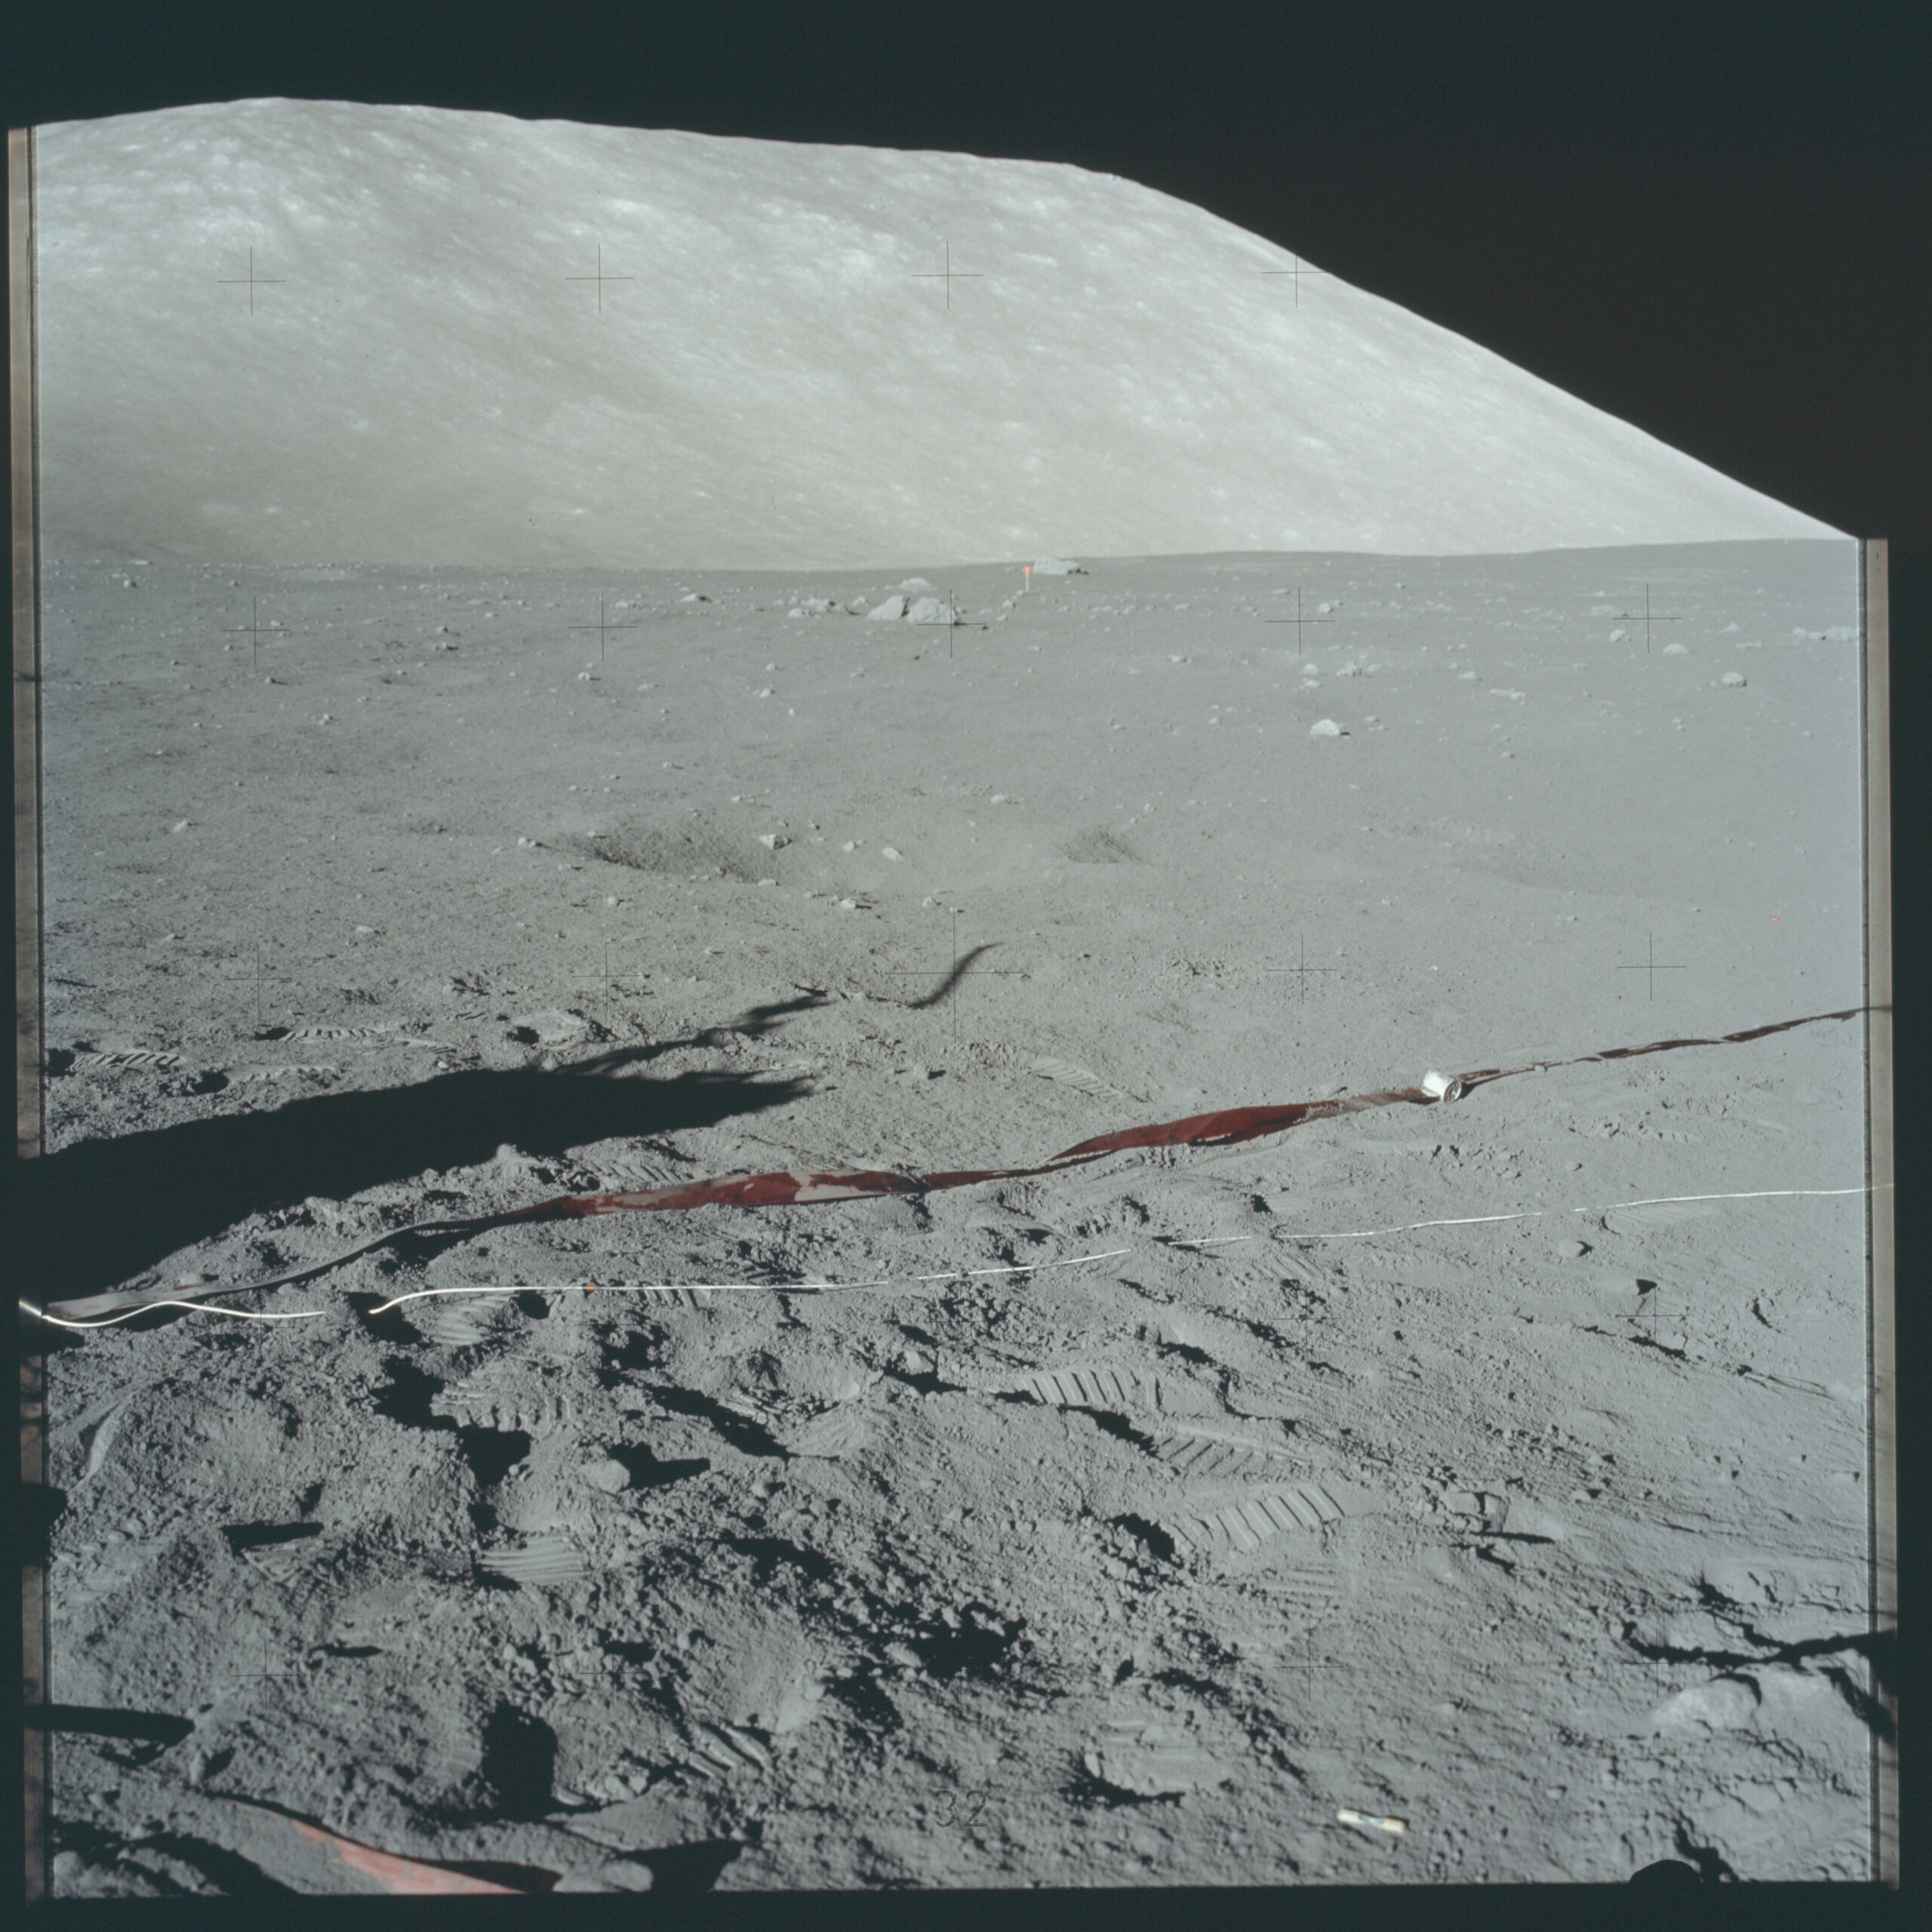
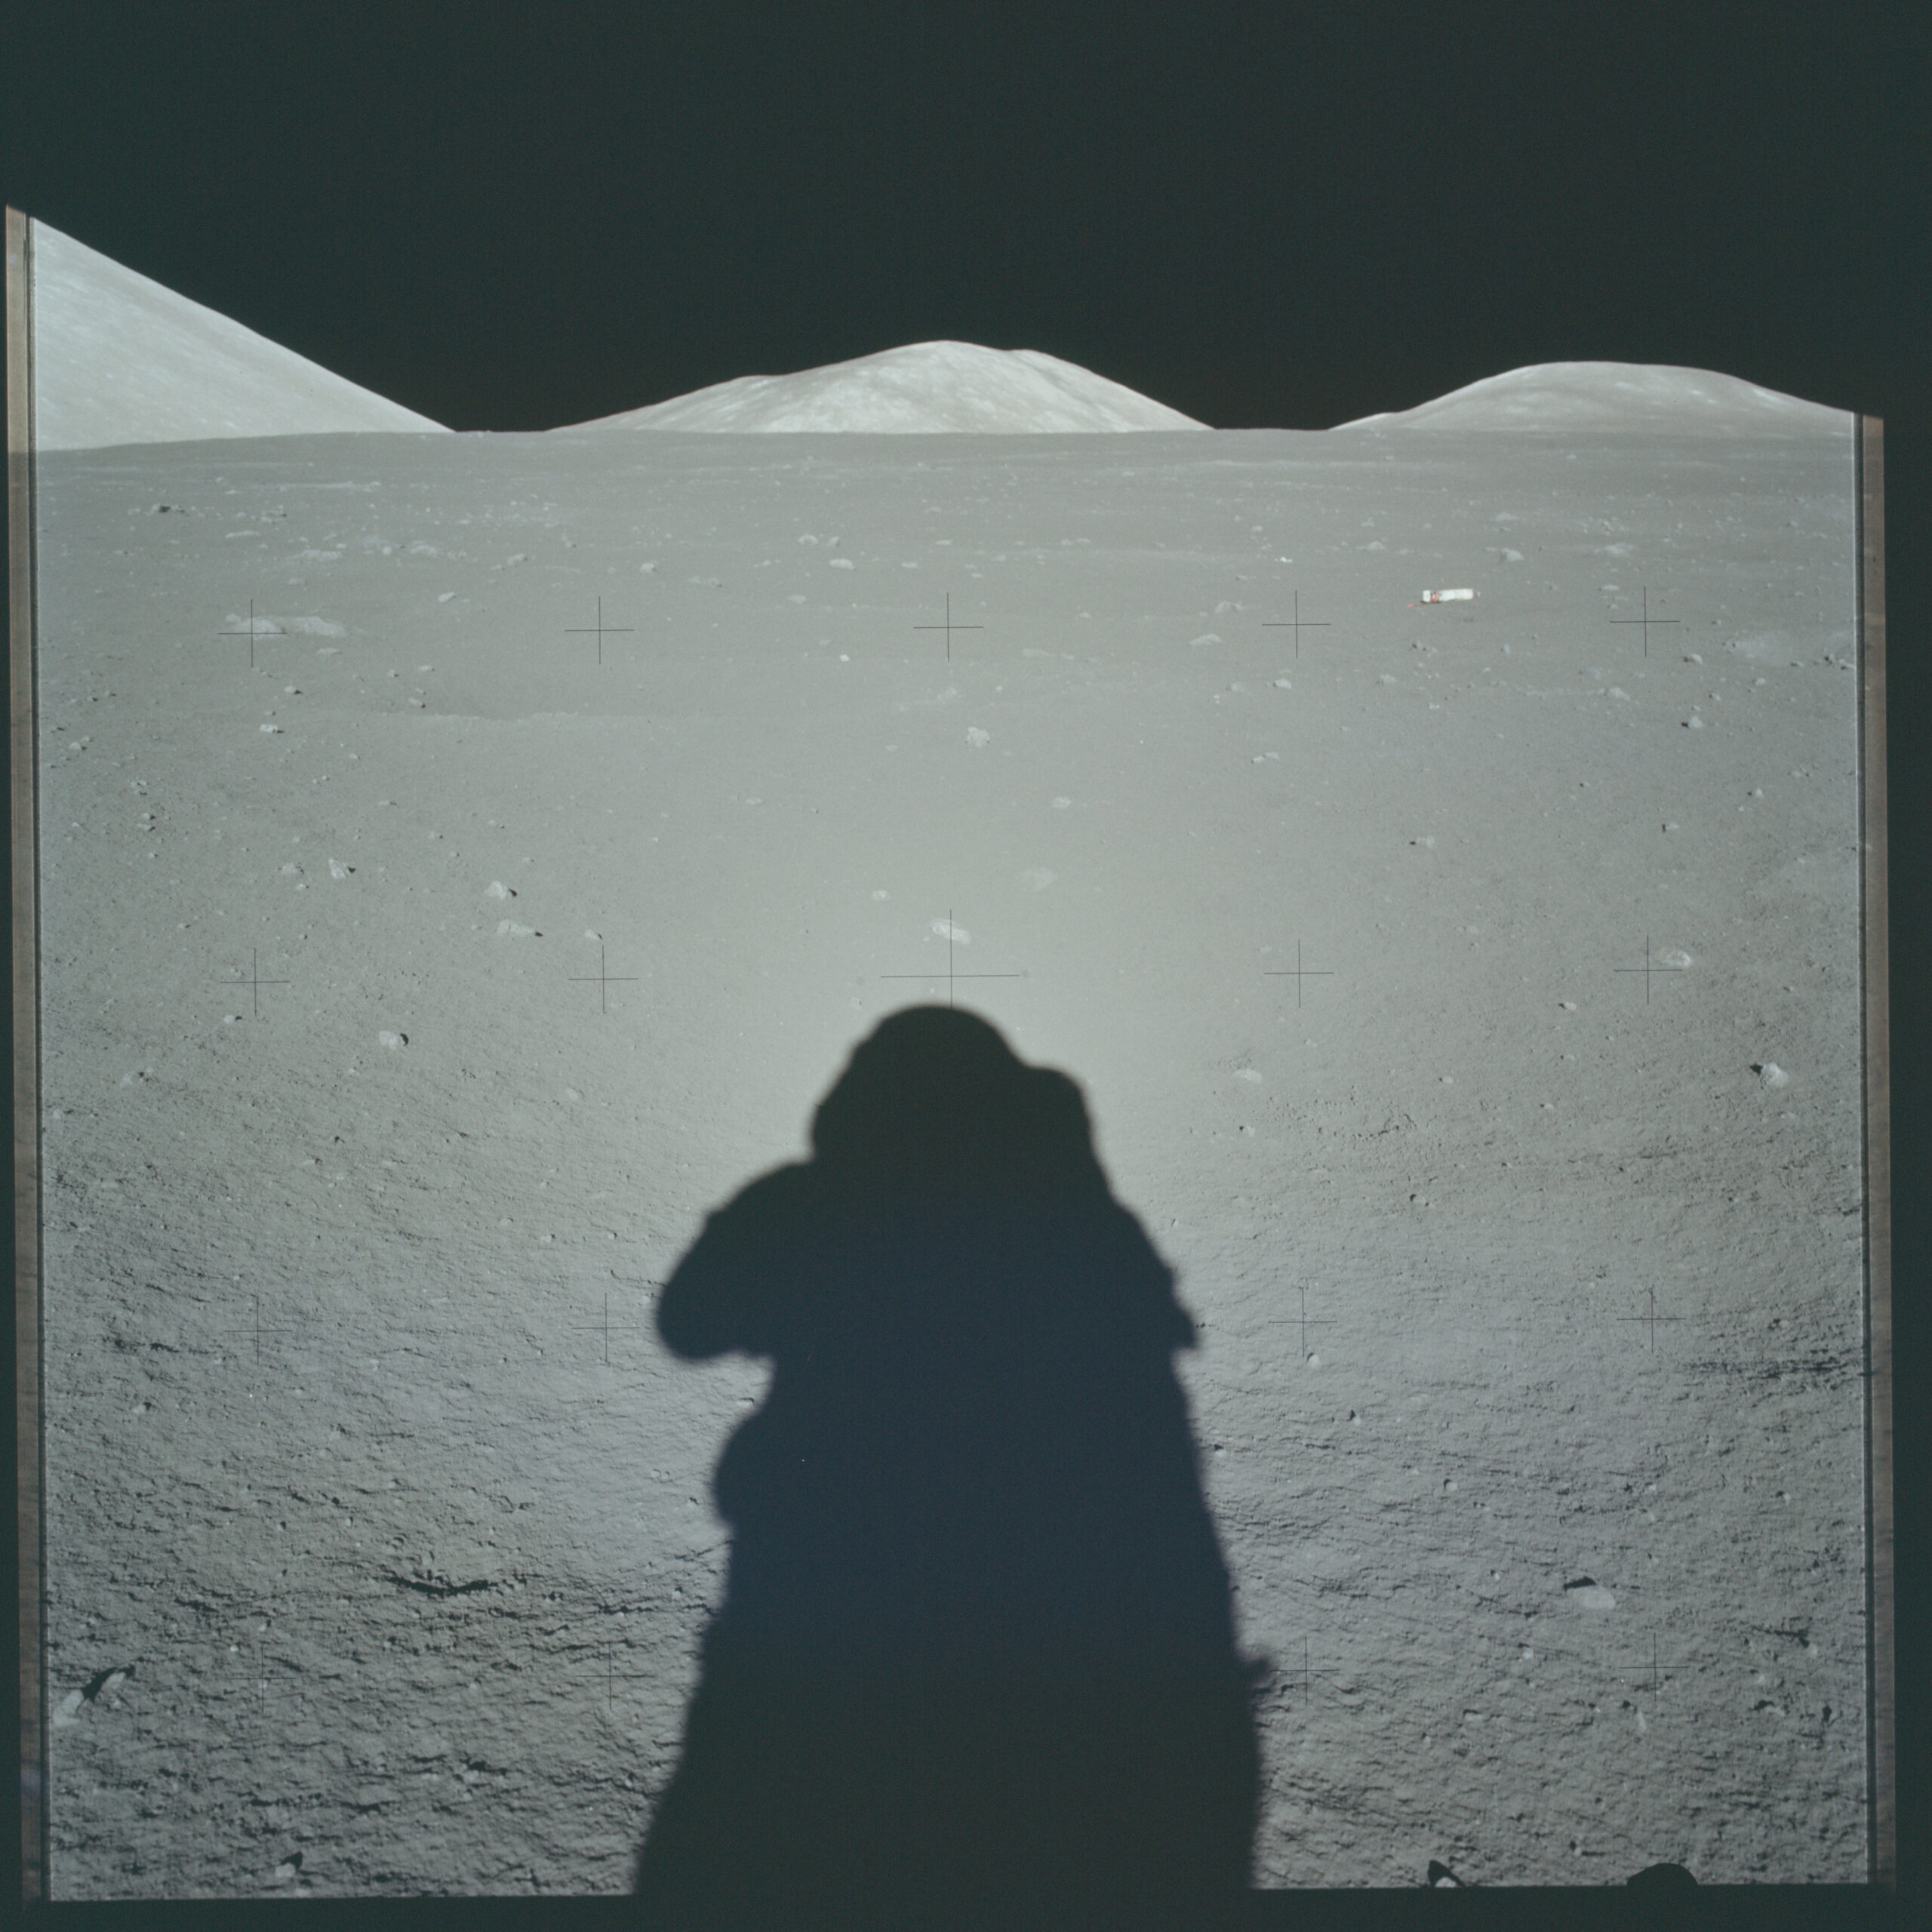
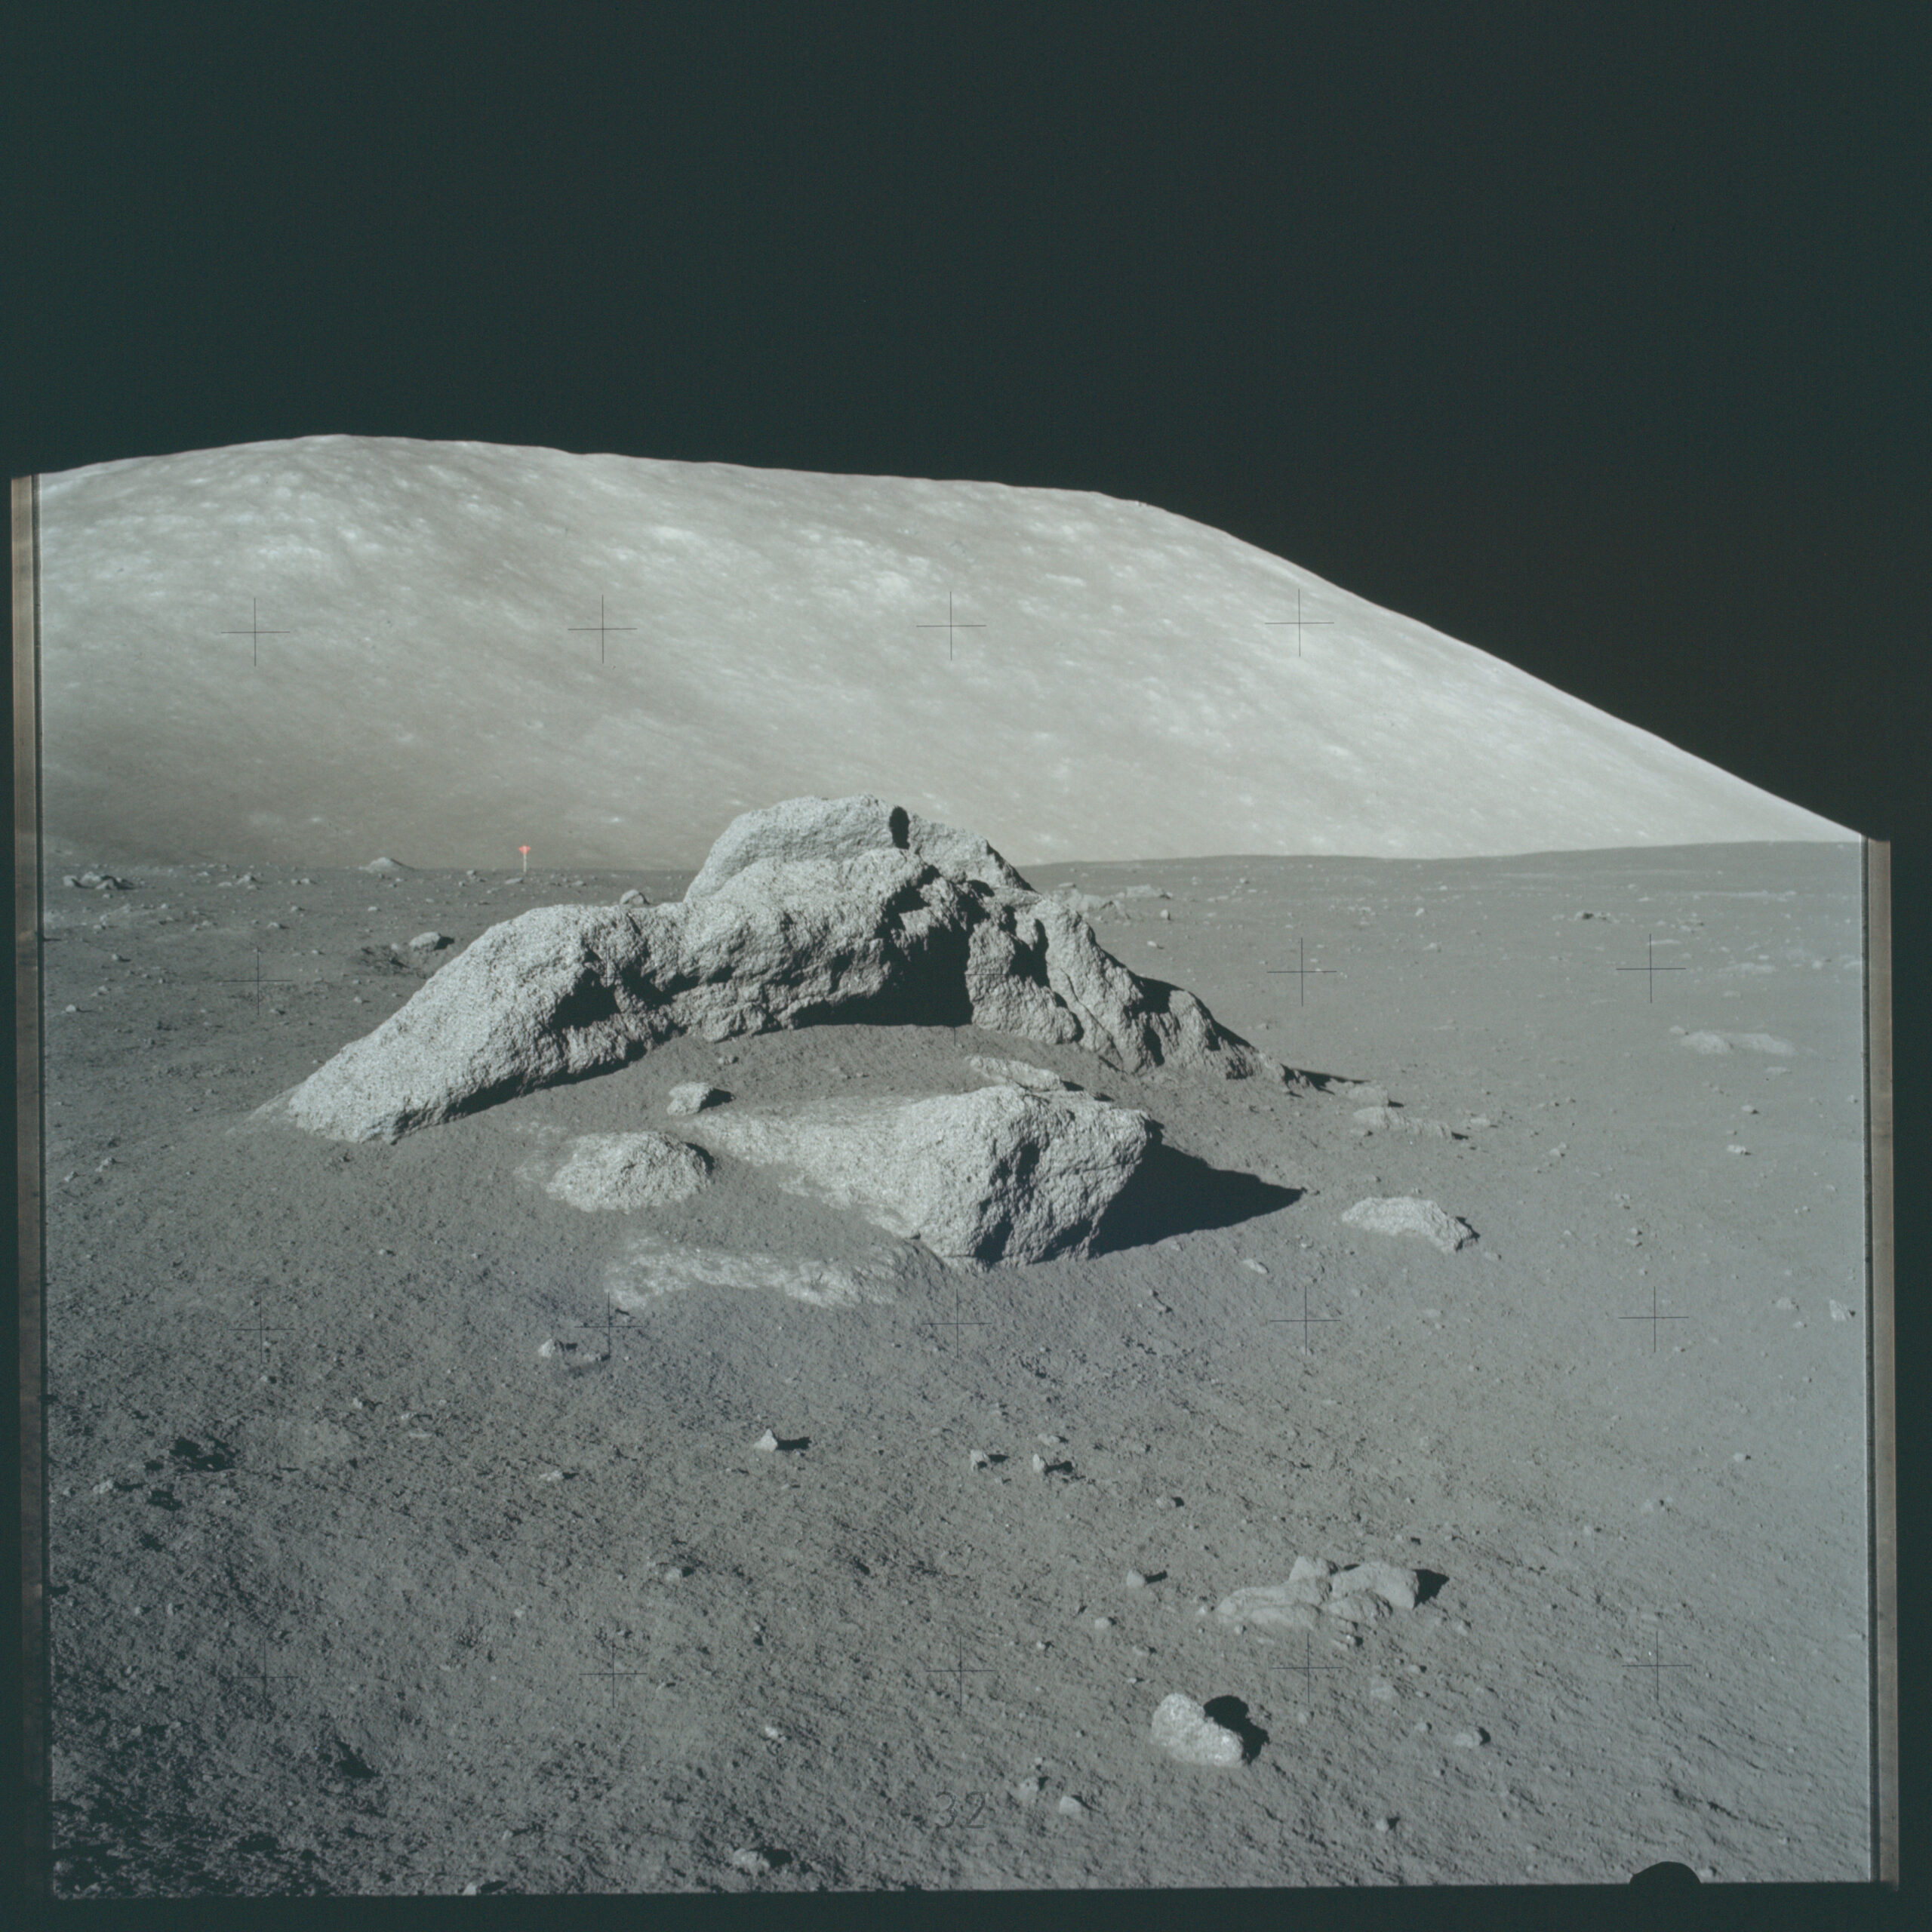
Credits : NASA / Apollo 17 crew
Superimposition of several photos of different wavelengths
In order to obtain accurate and complete scientific data, satellites take photos in different wavelengths or spectral bands.
A wavelength defines a very precise colour and its unit of measurement is the nanometre (nm), which represents the distance between two consecutive peaks (or troughs) of a light wave. When we note a spectral band, we generally write it as 317.5 ± 0.1. This means that we are looking at the colour with the wavelength 317.5nm with a margin of plus or minus 0.1nm (which is totally indiscernible to the naked eye).
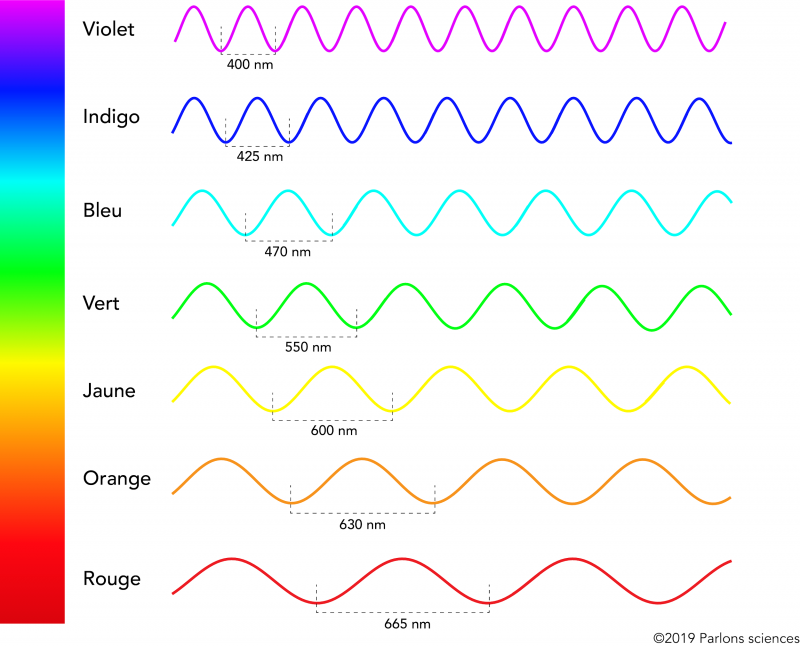
A spectral band is a ‘group’ of wavelengths. Instead of observing a specific colour, we will observe all those that are more or less close together.
In this section, we will use the EPIC 5 (Earth Polychromatic Imaging Camera) instrument on board the DSCOVR 6 (Deep Space Climate Observatory) satellite as an example.
Here are the different wavelengths photographed by EPIC and the associated colours:
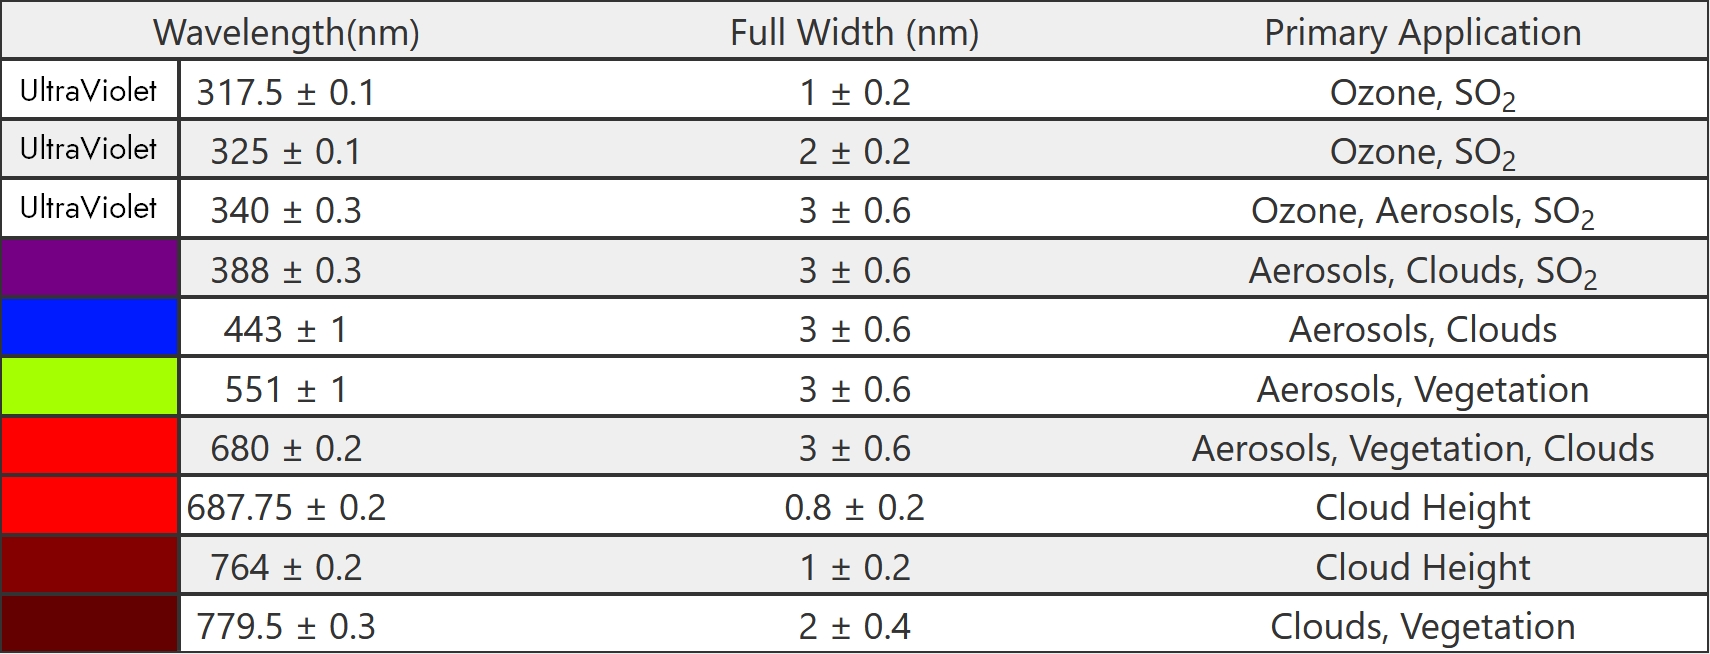
As shown in the table above, the different wavelengths are used to study different aspects of the Earth and the composition of its atmosphere: ozone, aerosols, clouds and their height in the sky, vegetation and SO₂ (sulphur dioxide) in the case of DSCOVR.
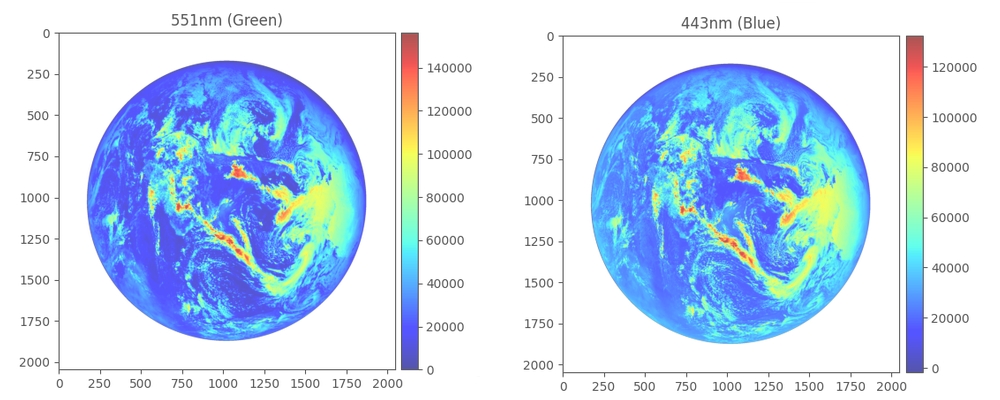
It is by assembling the 3 wavelengths of the primary colours of the RGB model, i.e. Red, Green and Blue (443, 551 and 680nm) that we obtain a natural colour photo.
The video below shows how to stack images of the three RGB wavelengths to obtain a natural colour photo.
I’m going to clarify a few things in the video, some of which are counter-intuitive:
- The palettes correspond to different ways of viewing the images and in no way to what will actually be stacked to obtain the final photo in natural colour.
- The raw data for each wavelength is difficult to visualise as it will be stacked. This is because the h5 file does not contain an image as such, but raw information about each pixel in the image. For each pixel, the luminous intensity information for the wavelength concerned is entered; for example, for the blue wavelength, the luminous intensity corresponding to blue is indicated for each pixel, and the same for red and green. When we stack the images, we create a ‘new’ pixel combining the luminous intensity information for each wavelength, which amounts to saying ‘for this pixel, there is such and such a quantity of blue, such and such a quantity of green and such and such a quantity of red’.
Assembling and distorting photos and using layers to create a photo of a planet
We are now going to tackle the most interesting part, but also the most technical: the construction of a photo of the Earth from photos taken with satellites in low orbit. There are two main families of satellites used to photograph the Earth: meteorological satellites and Earth observation satellites. They are located either in low Earth orbit (on average between 700 and 900 km altitude for the satellites that concern us in this article 6, but low Earth orbit extends to an altitude of 2,000 km 7) or in geostationary orbit at an altitude of 35,786 km. Low-Earth orbit satellites are not capable of photographing the Earth in its entirety, which is why it is necessary to assemble the photos.
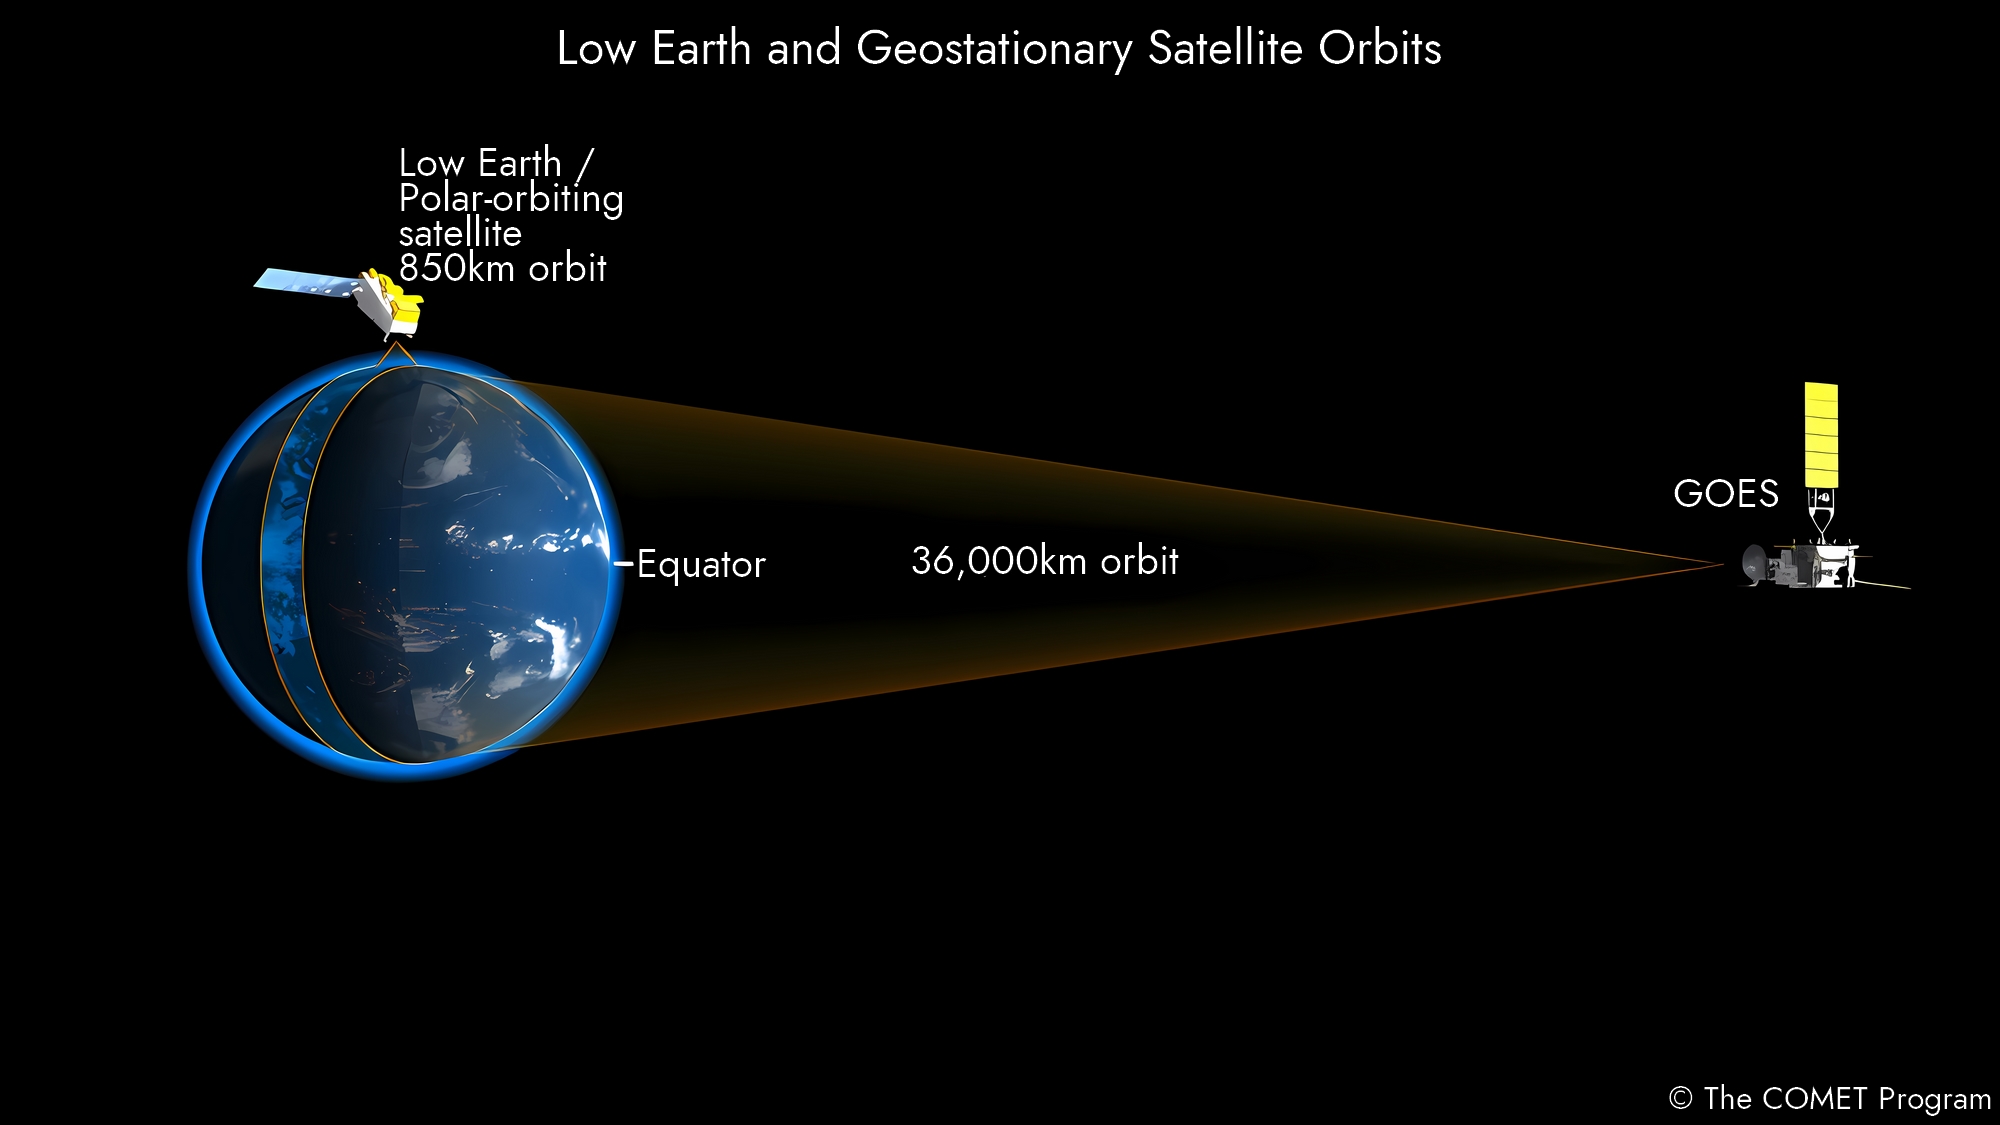
Credit : The COMET Program
In this section, we’ll take as an example the MODIS 8 imaging instrument on board NASA’s Terra and Aqua 9 10 satellites. Here’s what the orbit of these satellites and the coverage of the imaging instrument look like (in the animation, it’s actually the PACE satellite, because I couldn’t find an animation with good enough resolution for Terra and Aqua, but it looks like this)
Credits : NASA’s Scientific Visualization Studio 11
With this orbit and coverage, here is the result obtained by the Aqua satellite on 22 February 2022:

Credits : NASA / NASA Worldview 12
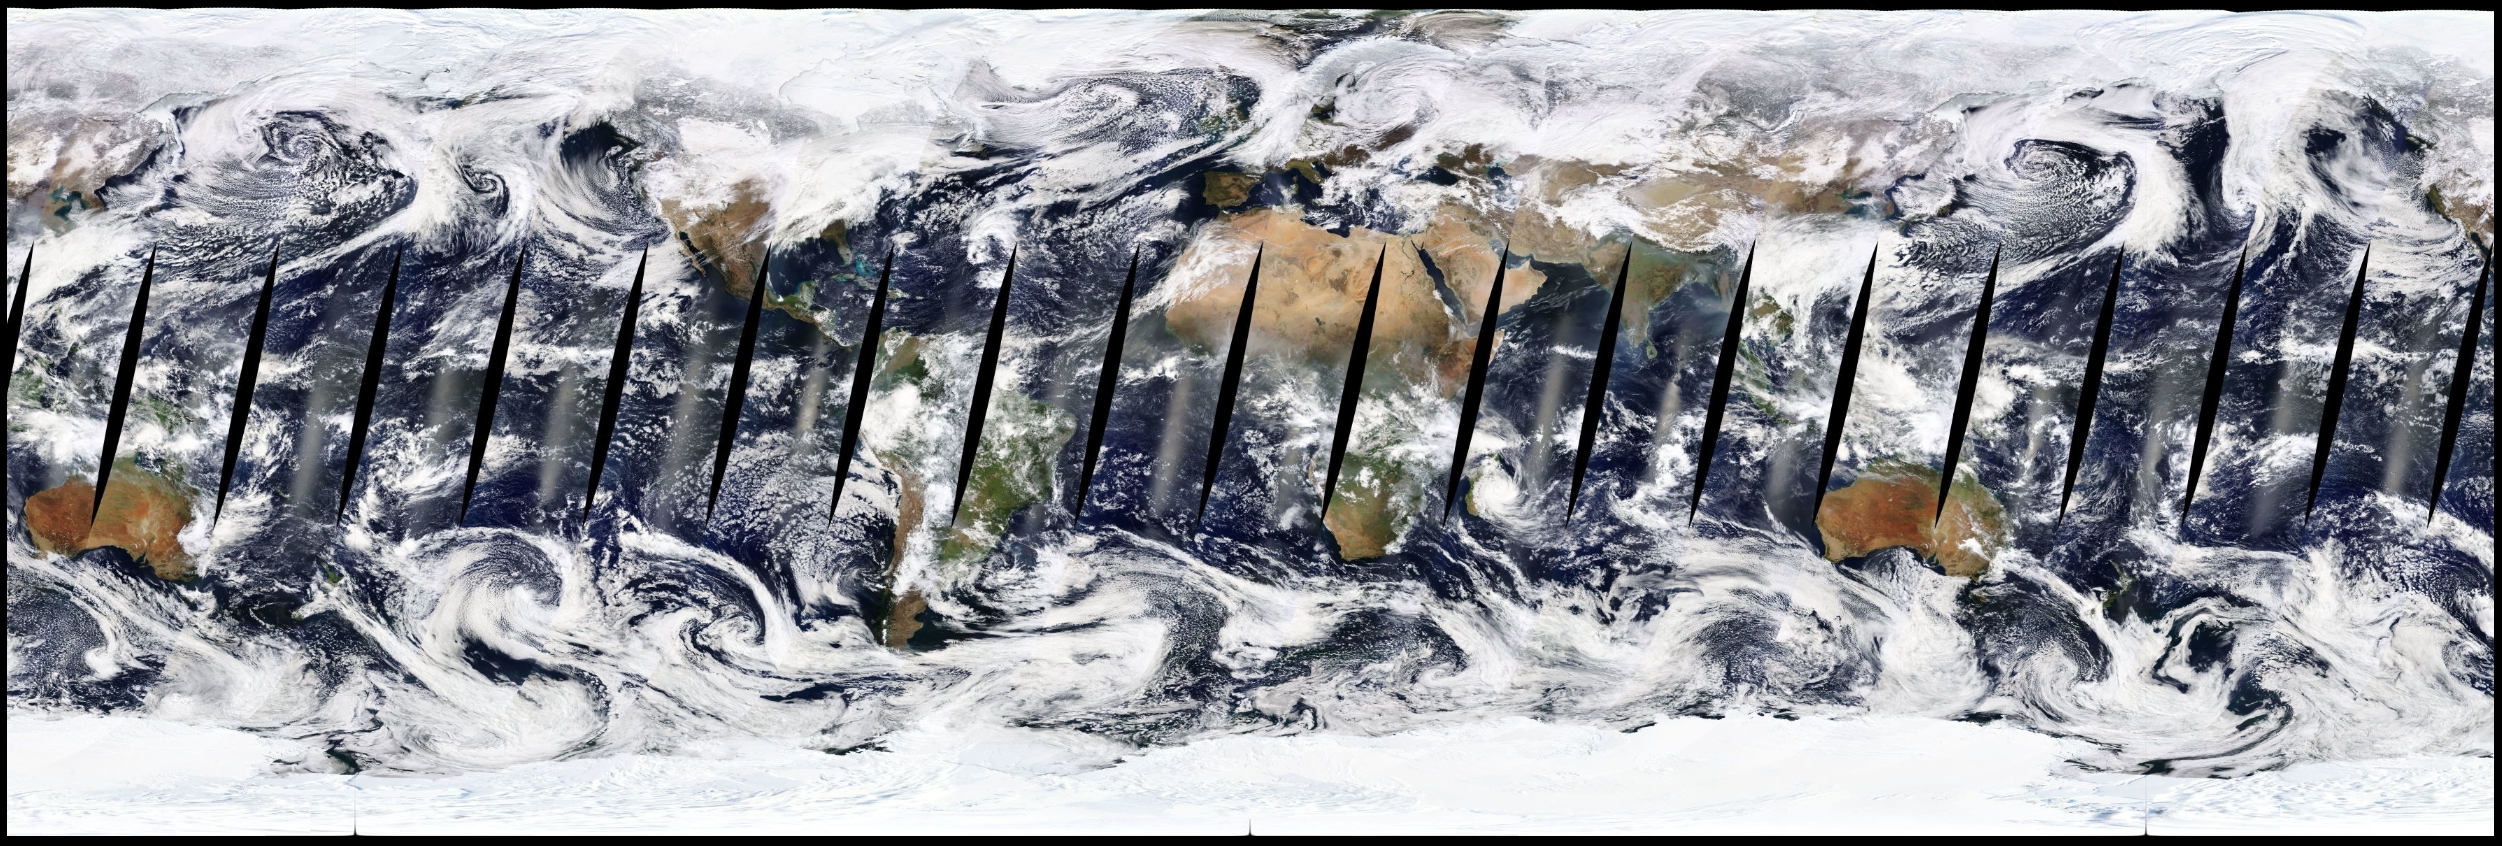
And the result obtained by the Terra satellite on the same day:
Credits : NASA / NASA Worldview 12
By superimposing the two, we can fill in some of the gaps:

Credits : NASA / NASA’s Goddard Space Flight Center 13
By collecting sufficient photos and data over several periods, it is possible to create layers of the oceans, the earth’s surface and clouds and to assemble them:
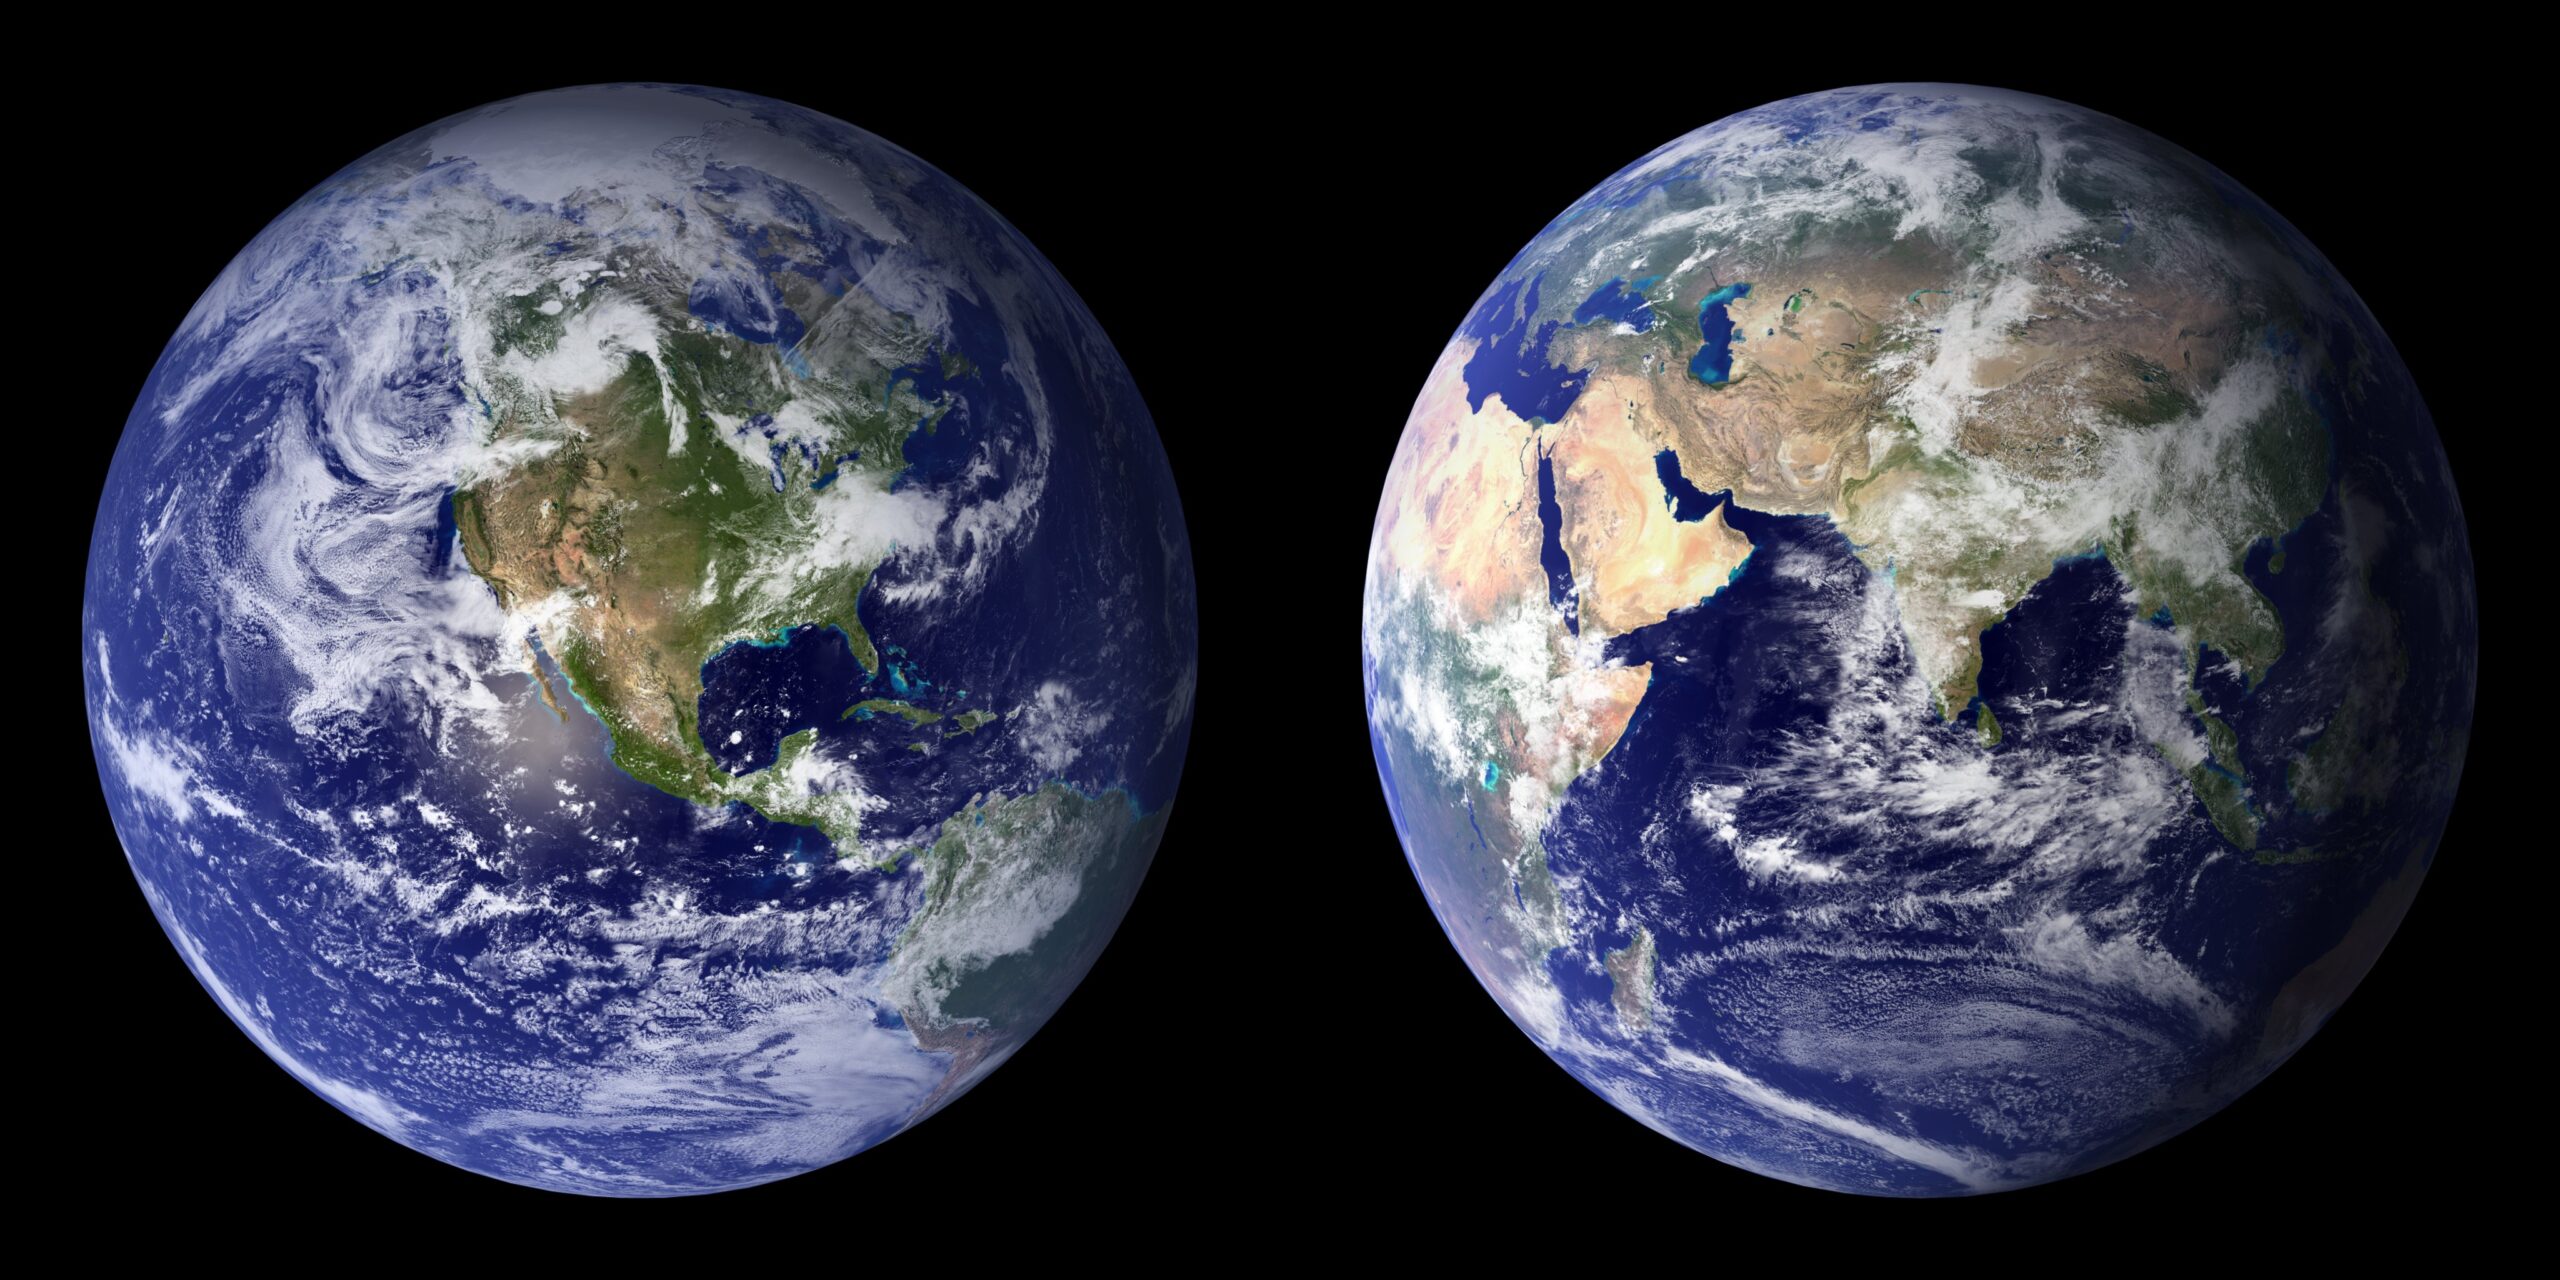
Credits : NASA Goddard Space Flight Center Image by Reto Stöckli (land surface, shallow water, clouds). Enhancements by Robert Simmon (ocean color, compositing, 3D globes, animation). Data and technical support: MODIS Land Group; MODIS Science Data Support Team; MODIS Atmosphere Group; MODIS Ocean Group Additional data: USGS EROS Data Center (topography); USGS Terrestrial Remote Sensing Flagstaff Field Center (Antarctica); Defense Meteorological Satellite Program (city lights).
The two Blue Marble 14 photos above were not constructed from the data presented above, but from several other dates: The land surface data were acquired between June and September 2001. The cloud data were acquired on two separate days: 29 July 2001 for the northern hemisphere and 16 November 2001 for the southern hemisphere. 15
Indeed, as explained above, in a composite photo, it is very common for several sets of data from several days to be used. Since the instruments on board the satellites are capable of obtaining images in a very wide range of wavelengths, it is possible to highlight and isolate certain elements (oceans, clouds, land surface, etc).
Here, for example, is a mask that has been created to visualise cloud cover and detect where the sky is completely clear: the more red the colour, the clearer the sky. I’ve superimposed it on Terra’s photo data to give you a better idea:
Credits : NASA / NASA Worldview 12
This is the technique used to construct the composite photo of the globe shown above: mainly using these two different layers of the cloudless planet and the clouds alone:
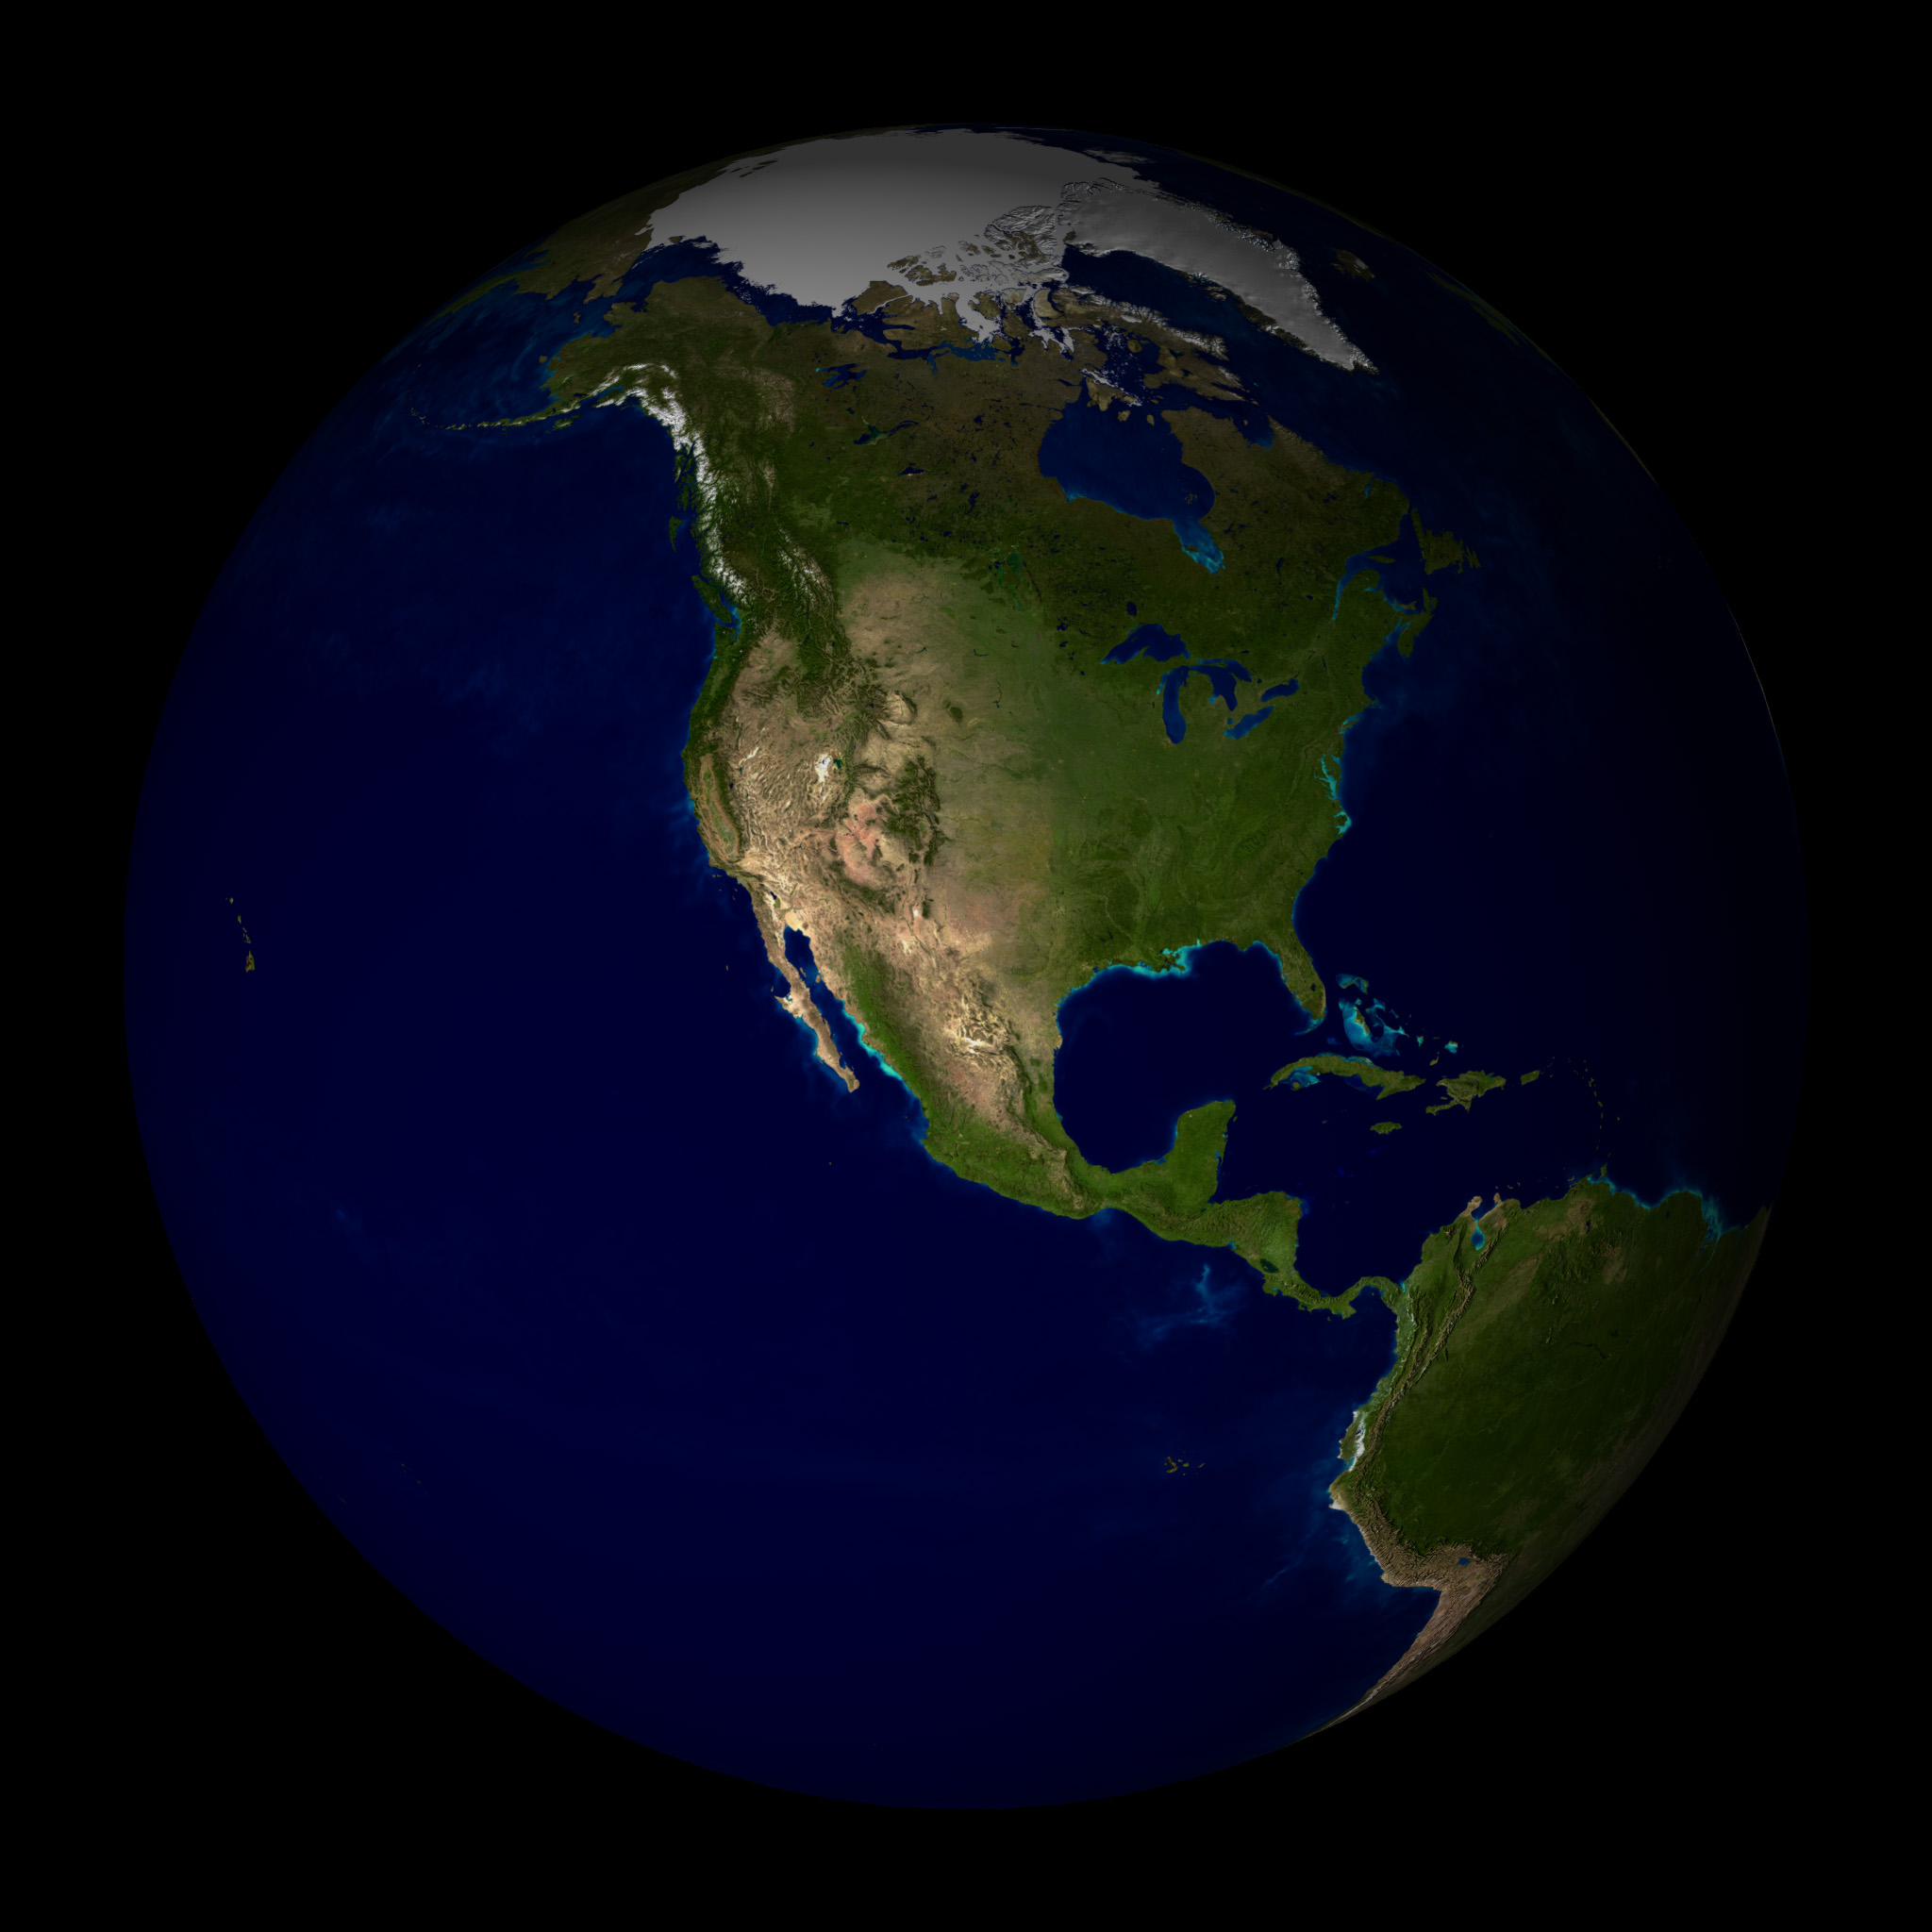
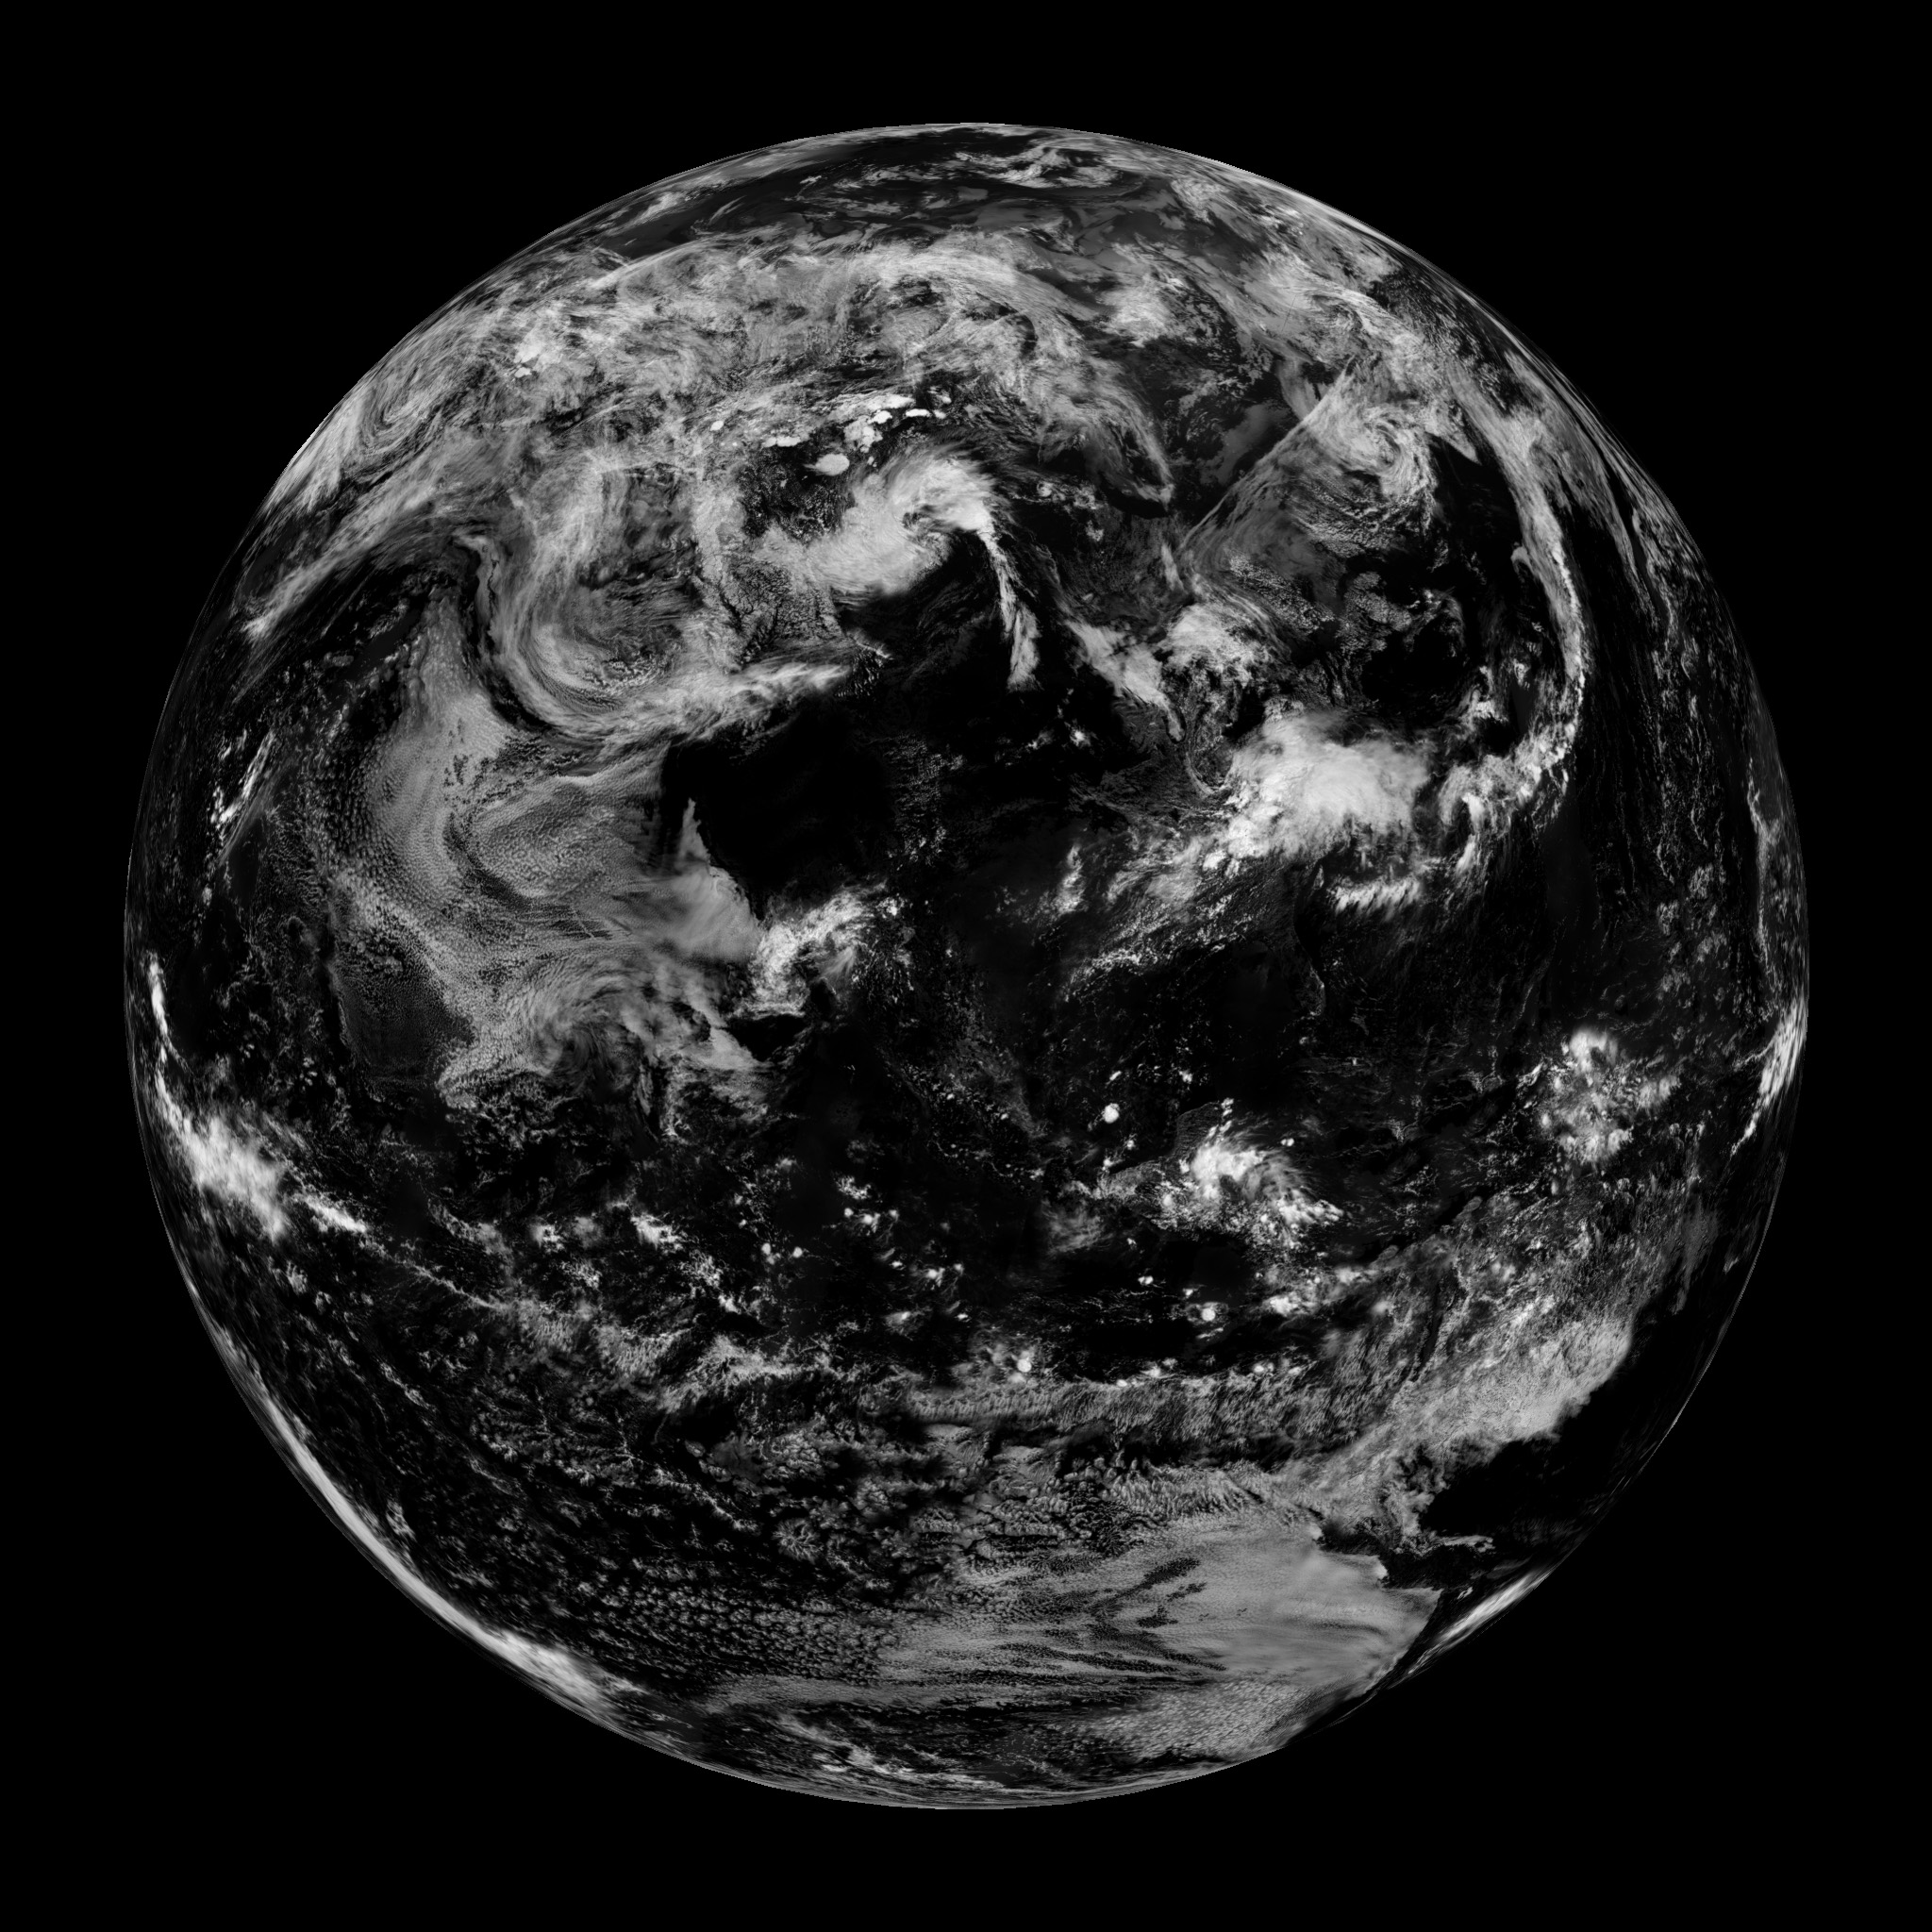
Credits : NASA Goddard Space Flight Center
Image by Reto Stöckli (land surface, shallow water, clouds). Enhancements by Robert Simmon (ocean colour, compositing, 3D globes, animation). 16 17
Conspiracy theorists and composite photos: a long story…
Conspiracy theorists love to use the composite photo argument to say that there are no real photos of the Earth in its entirety and that they are all computer-generated. While it is true that satellites provide composite photos, it is totally false to say that they are fake, in fact, this ignores the following facts:
- Even if they can be constructed by assembling, deforming and using layers, as we saw in the previous chapter, they are based on real data and satellite photos.
- Composite photos constructed from the three RGB wavelengths simply use 3 real photos in 3 different colours, which is a bit like saying that the photos on your smartphone or SLR camera are fake because their CMOS 18 or CCD 19 sensors process the light they receive using photosites 20 and a matrix of coloured filters 21 that only let red, green or blue through.
The photos taken by DSCOVR cannot therefore be considered composite in the sense that the conspiracy theorists use the term.
What’s more, there are photos taken with conventional cameras, such as those of the Earth taken by the Apollo missions or on board the International Space Station. Although photos taken from the ISS do not show the Earth as a whole due to its relatively low altitude, the Earth’s curvature is clearly visible in tens or even hundreds of thousands of shots.
Here is a small selection of photos of the Earth taken during the Apollo missions, using a Hasselblad film camera:
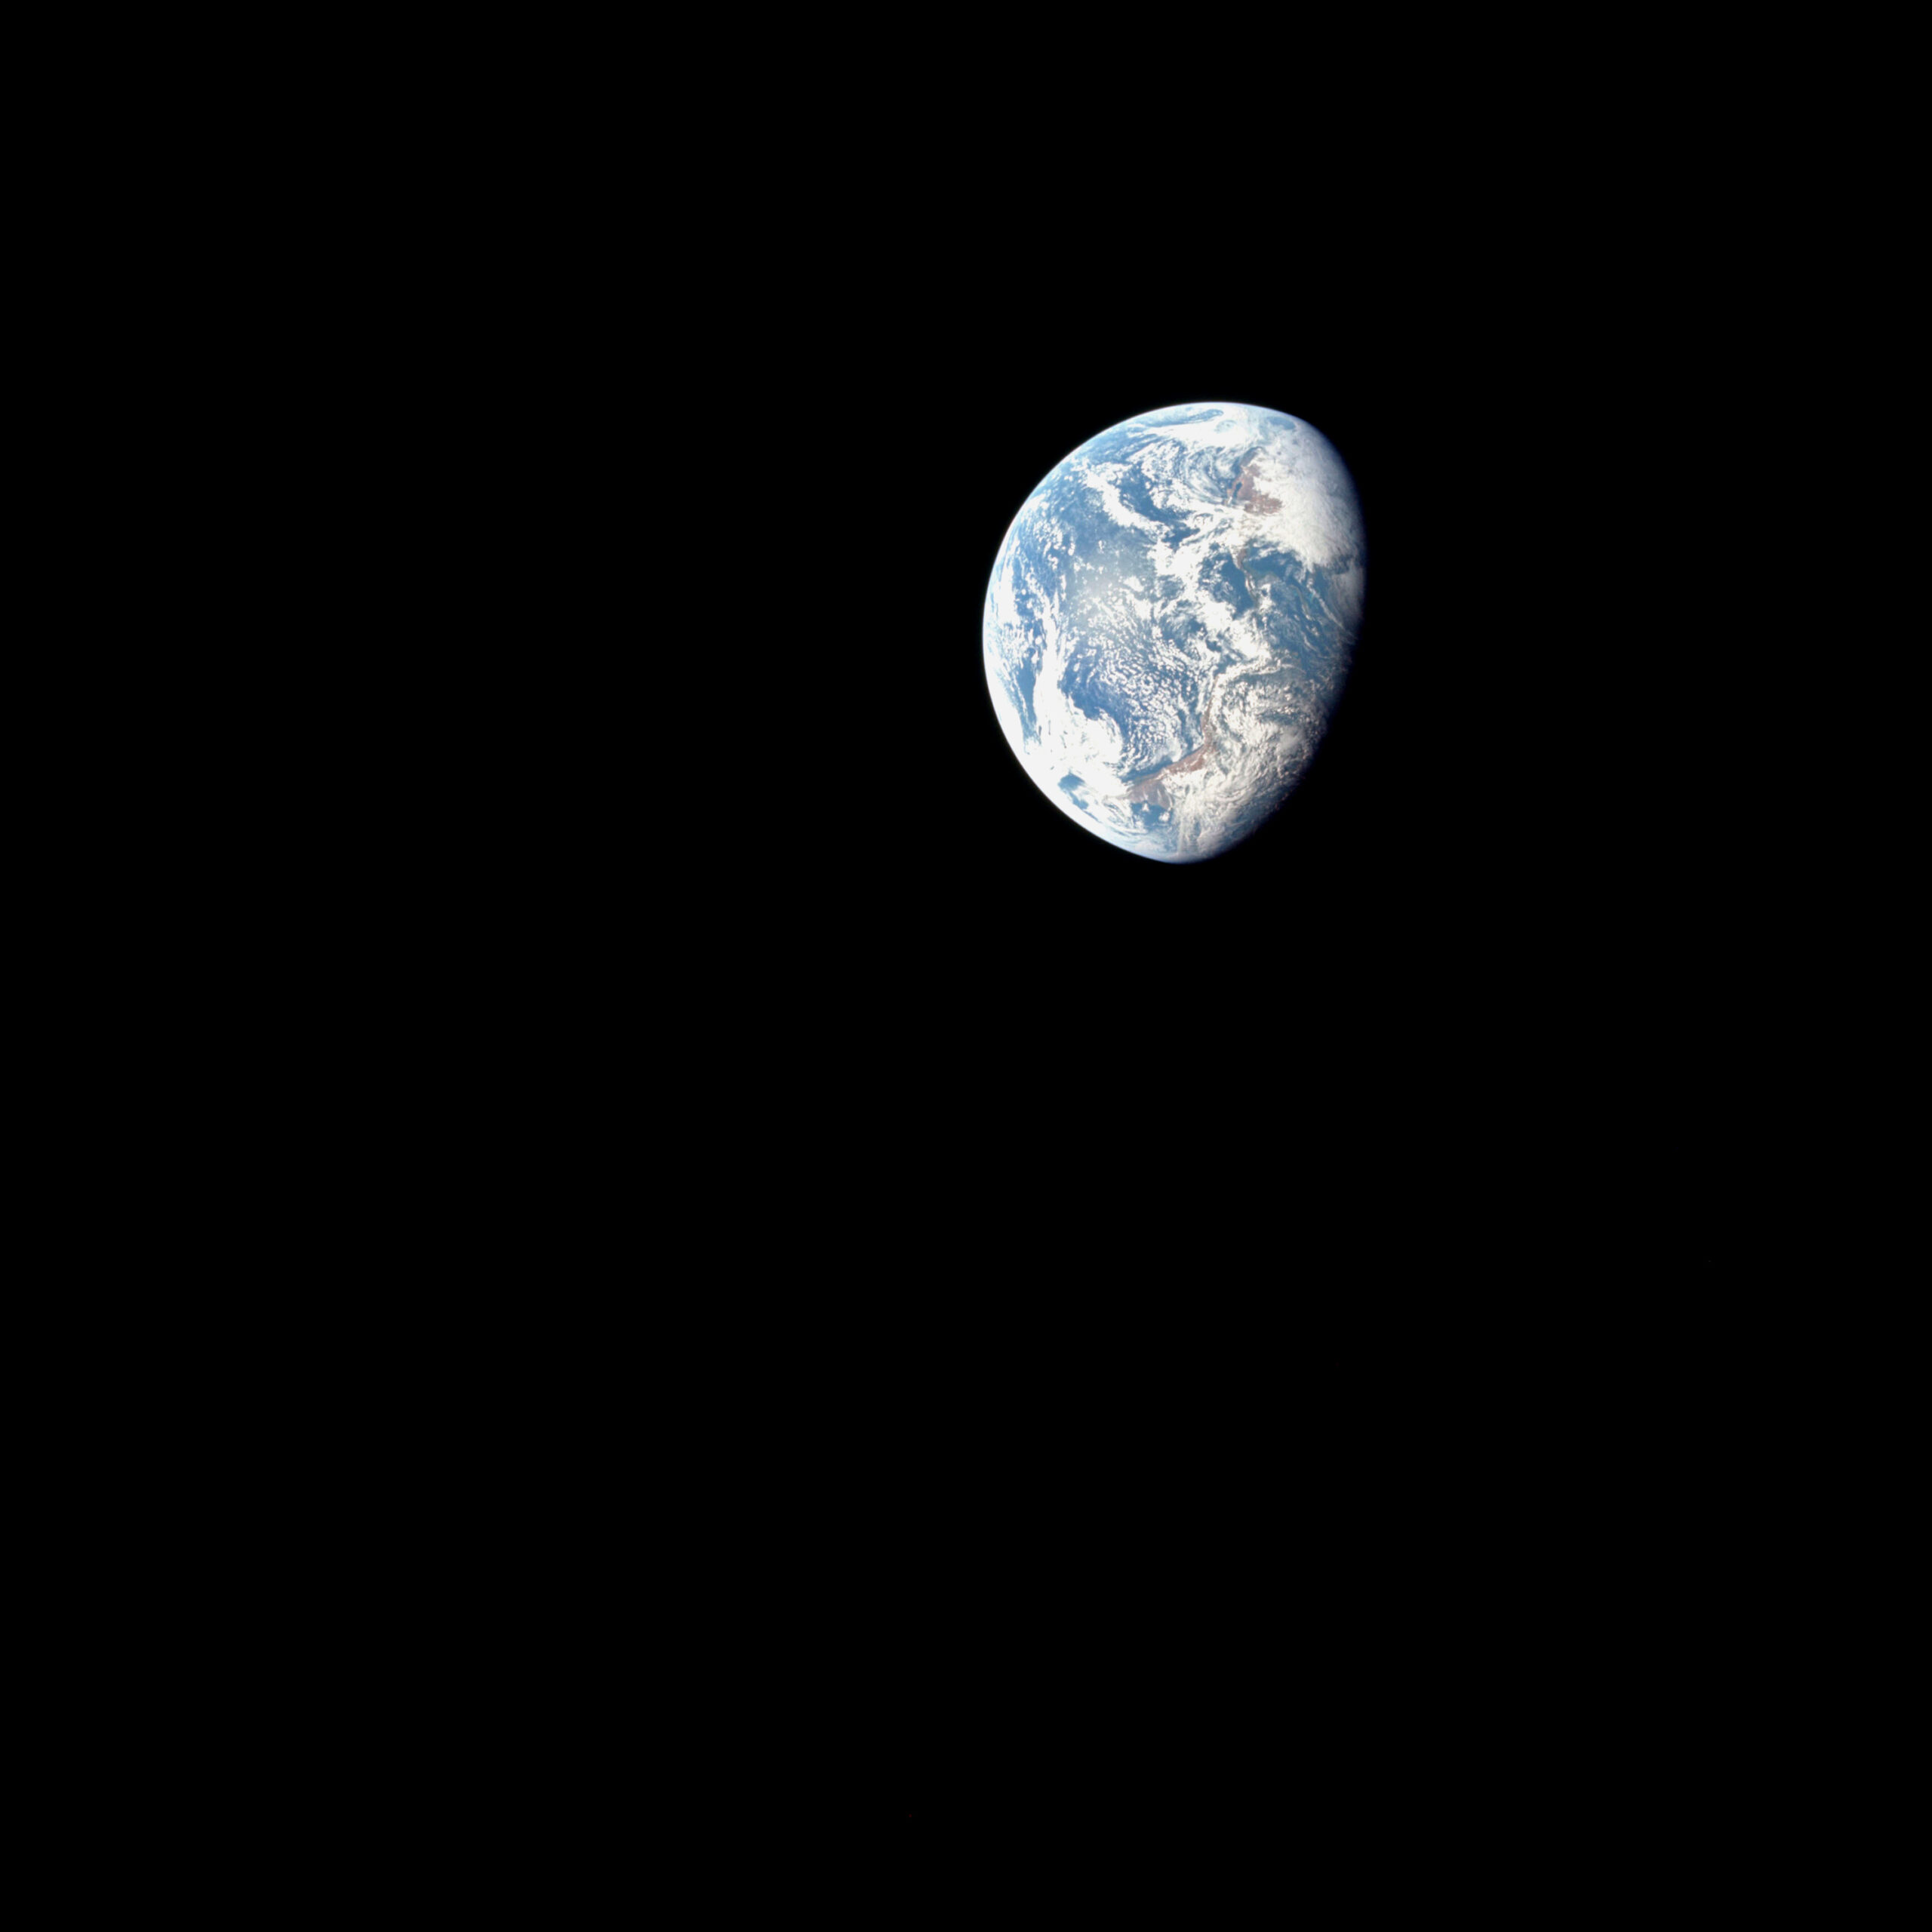

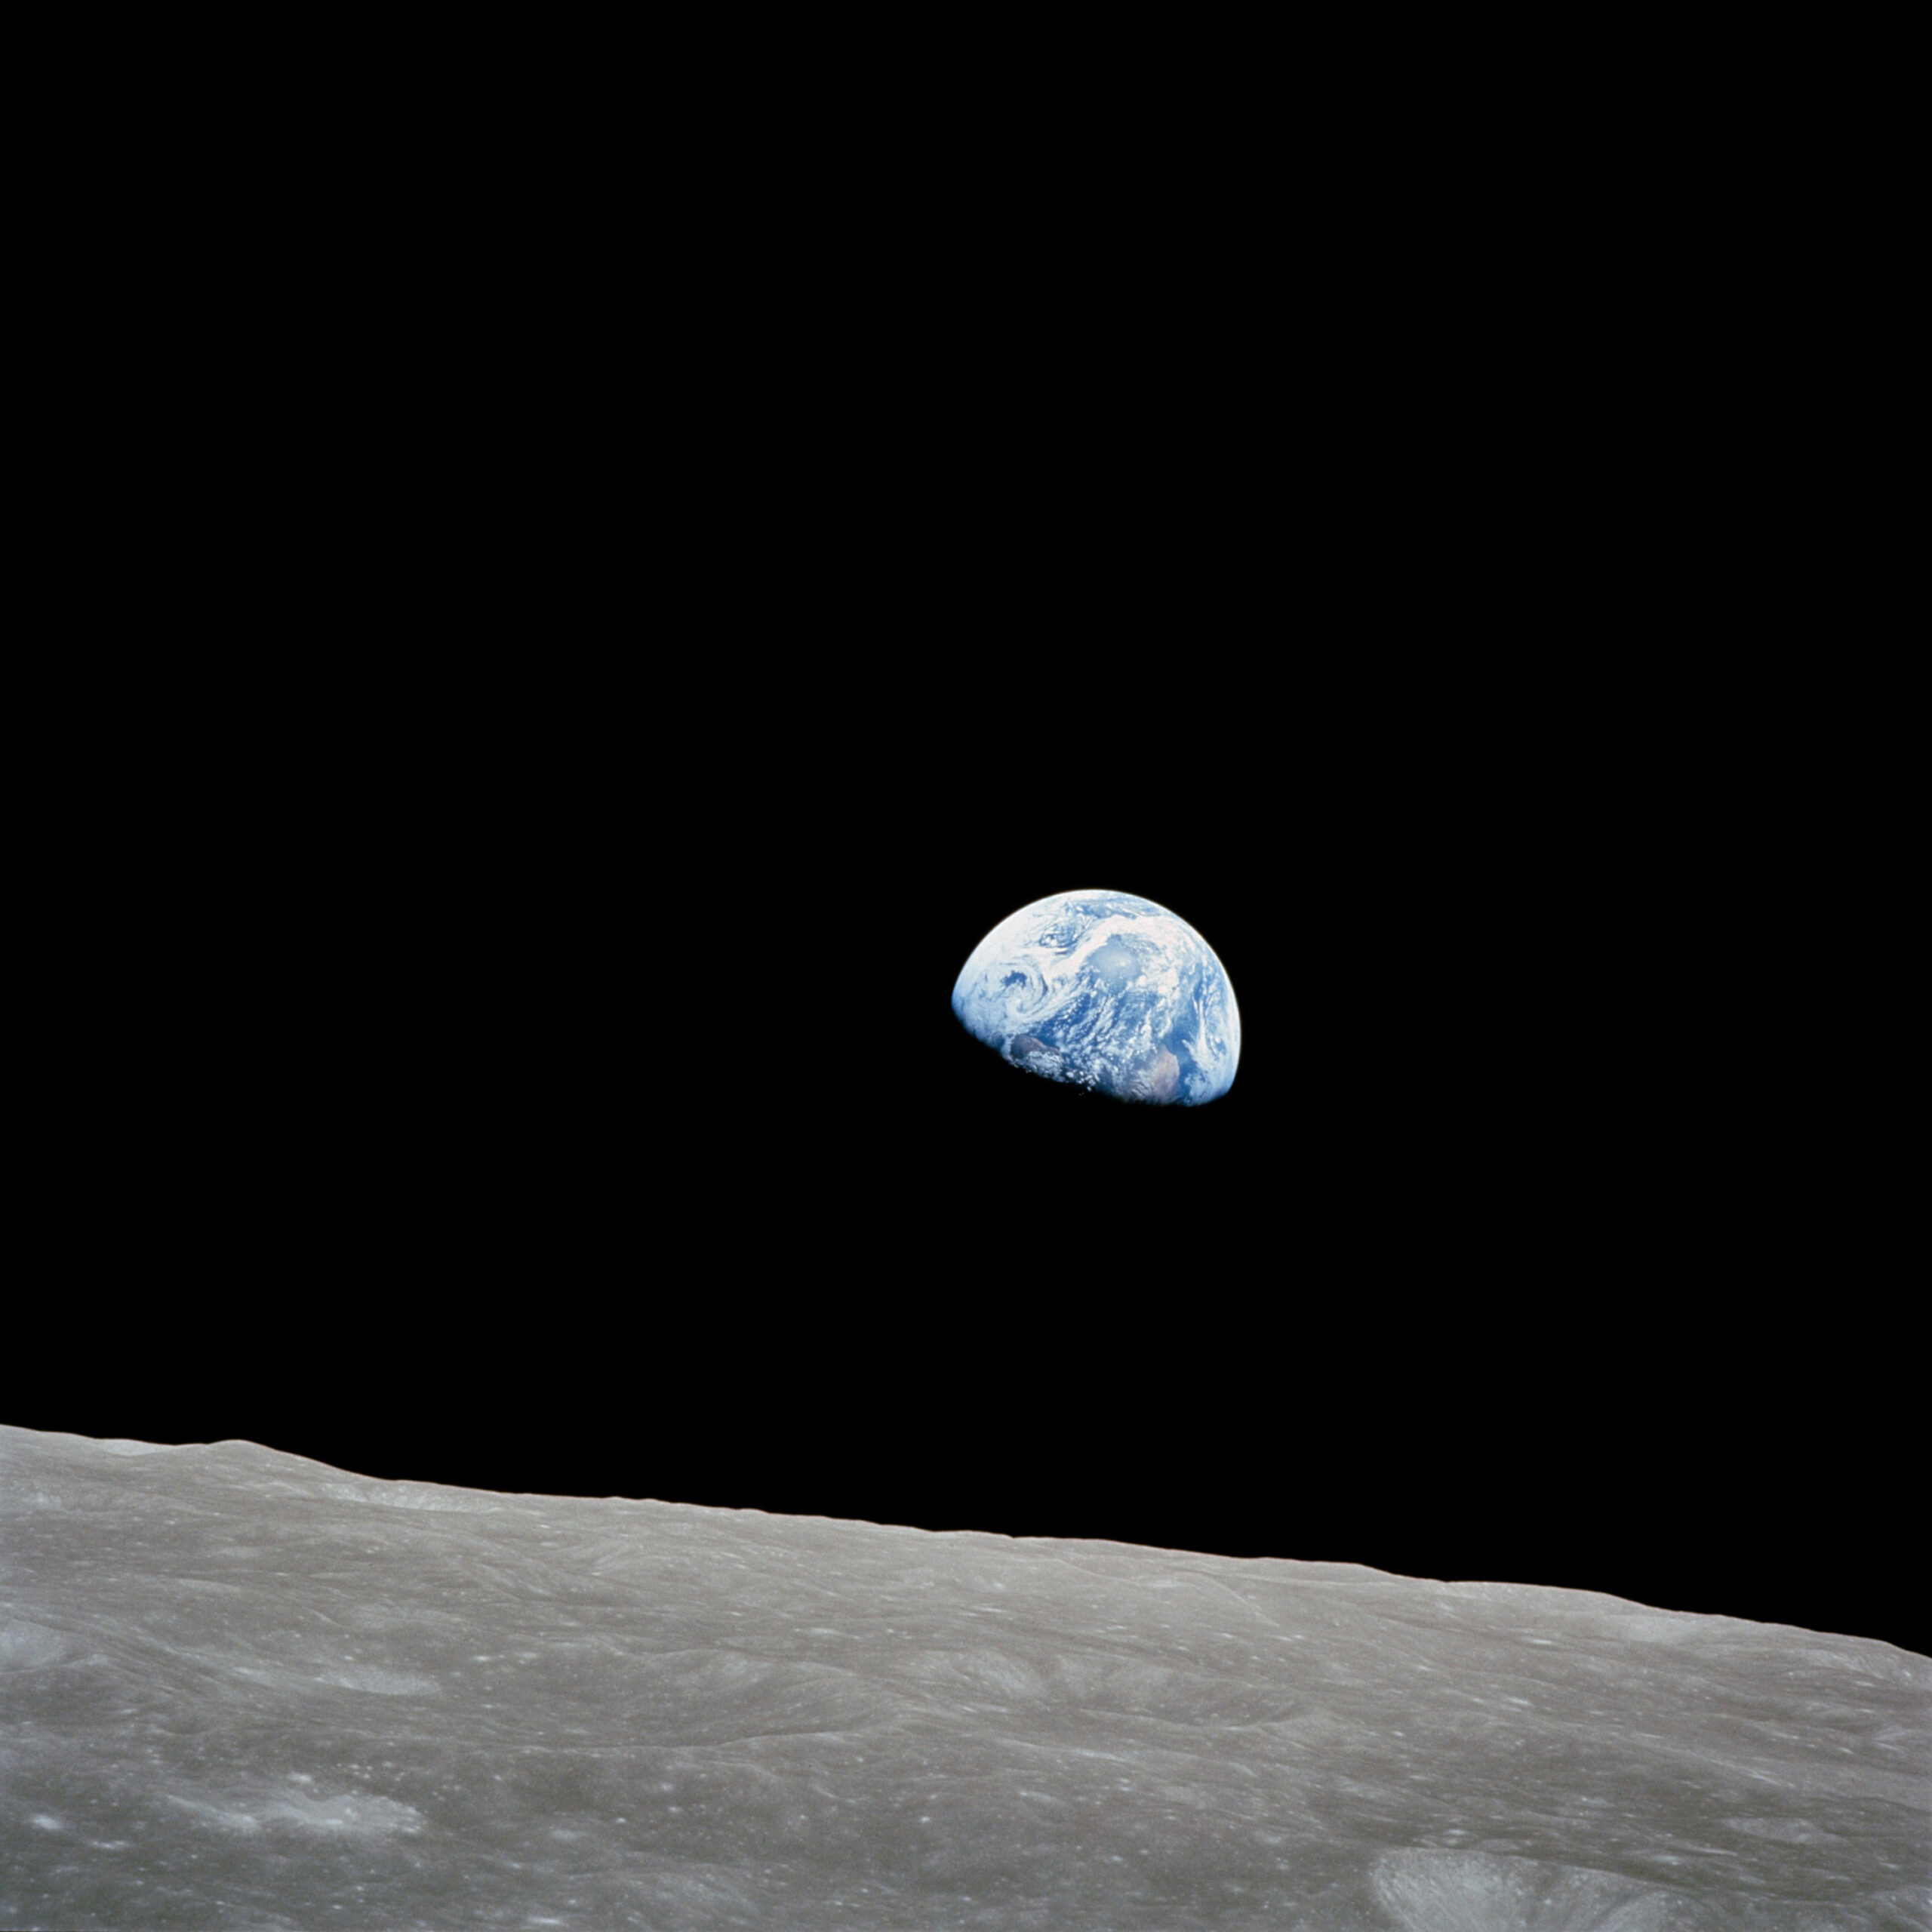

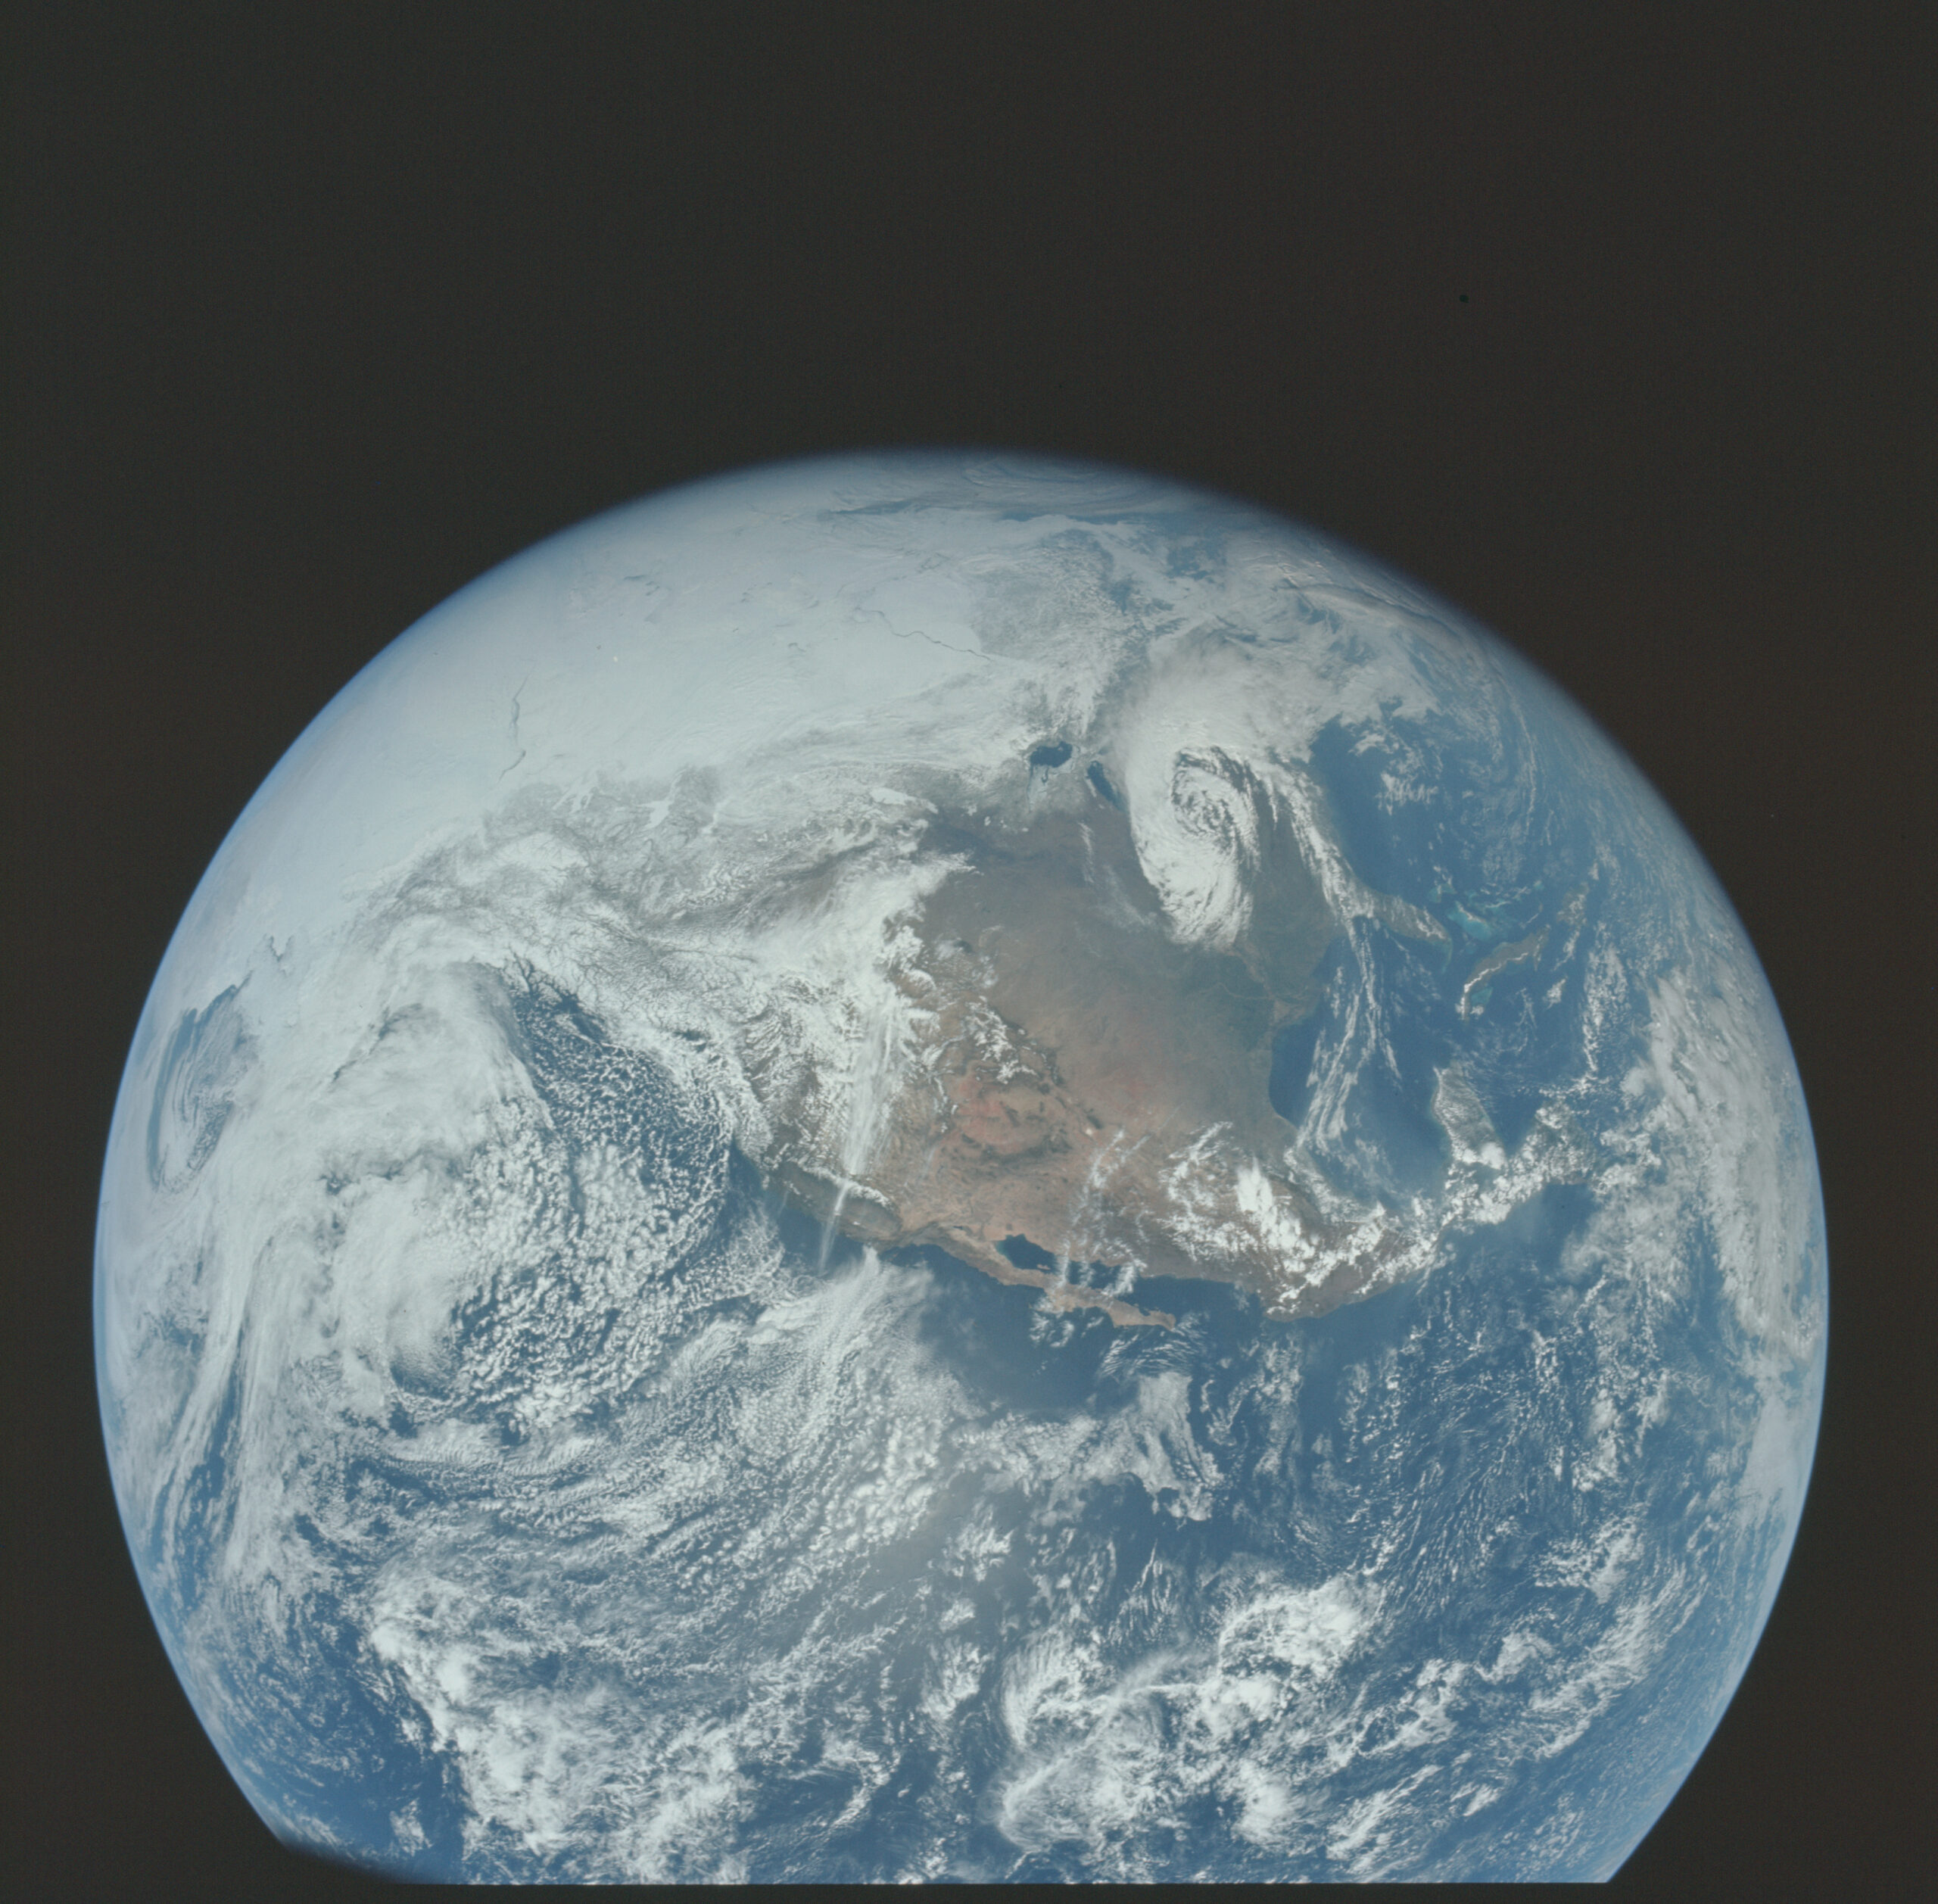

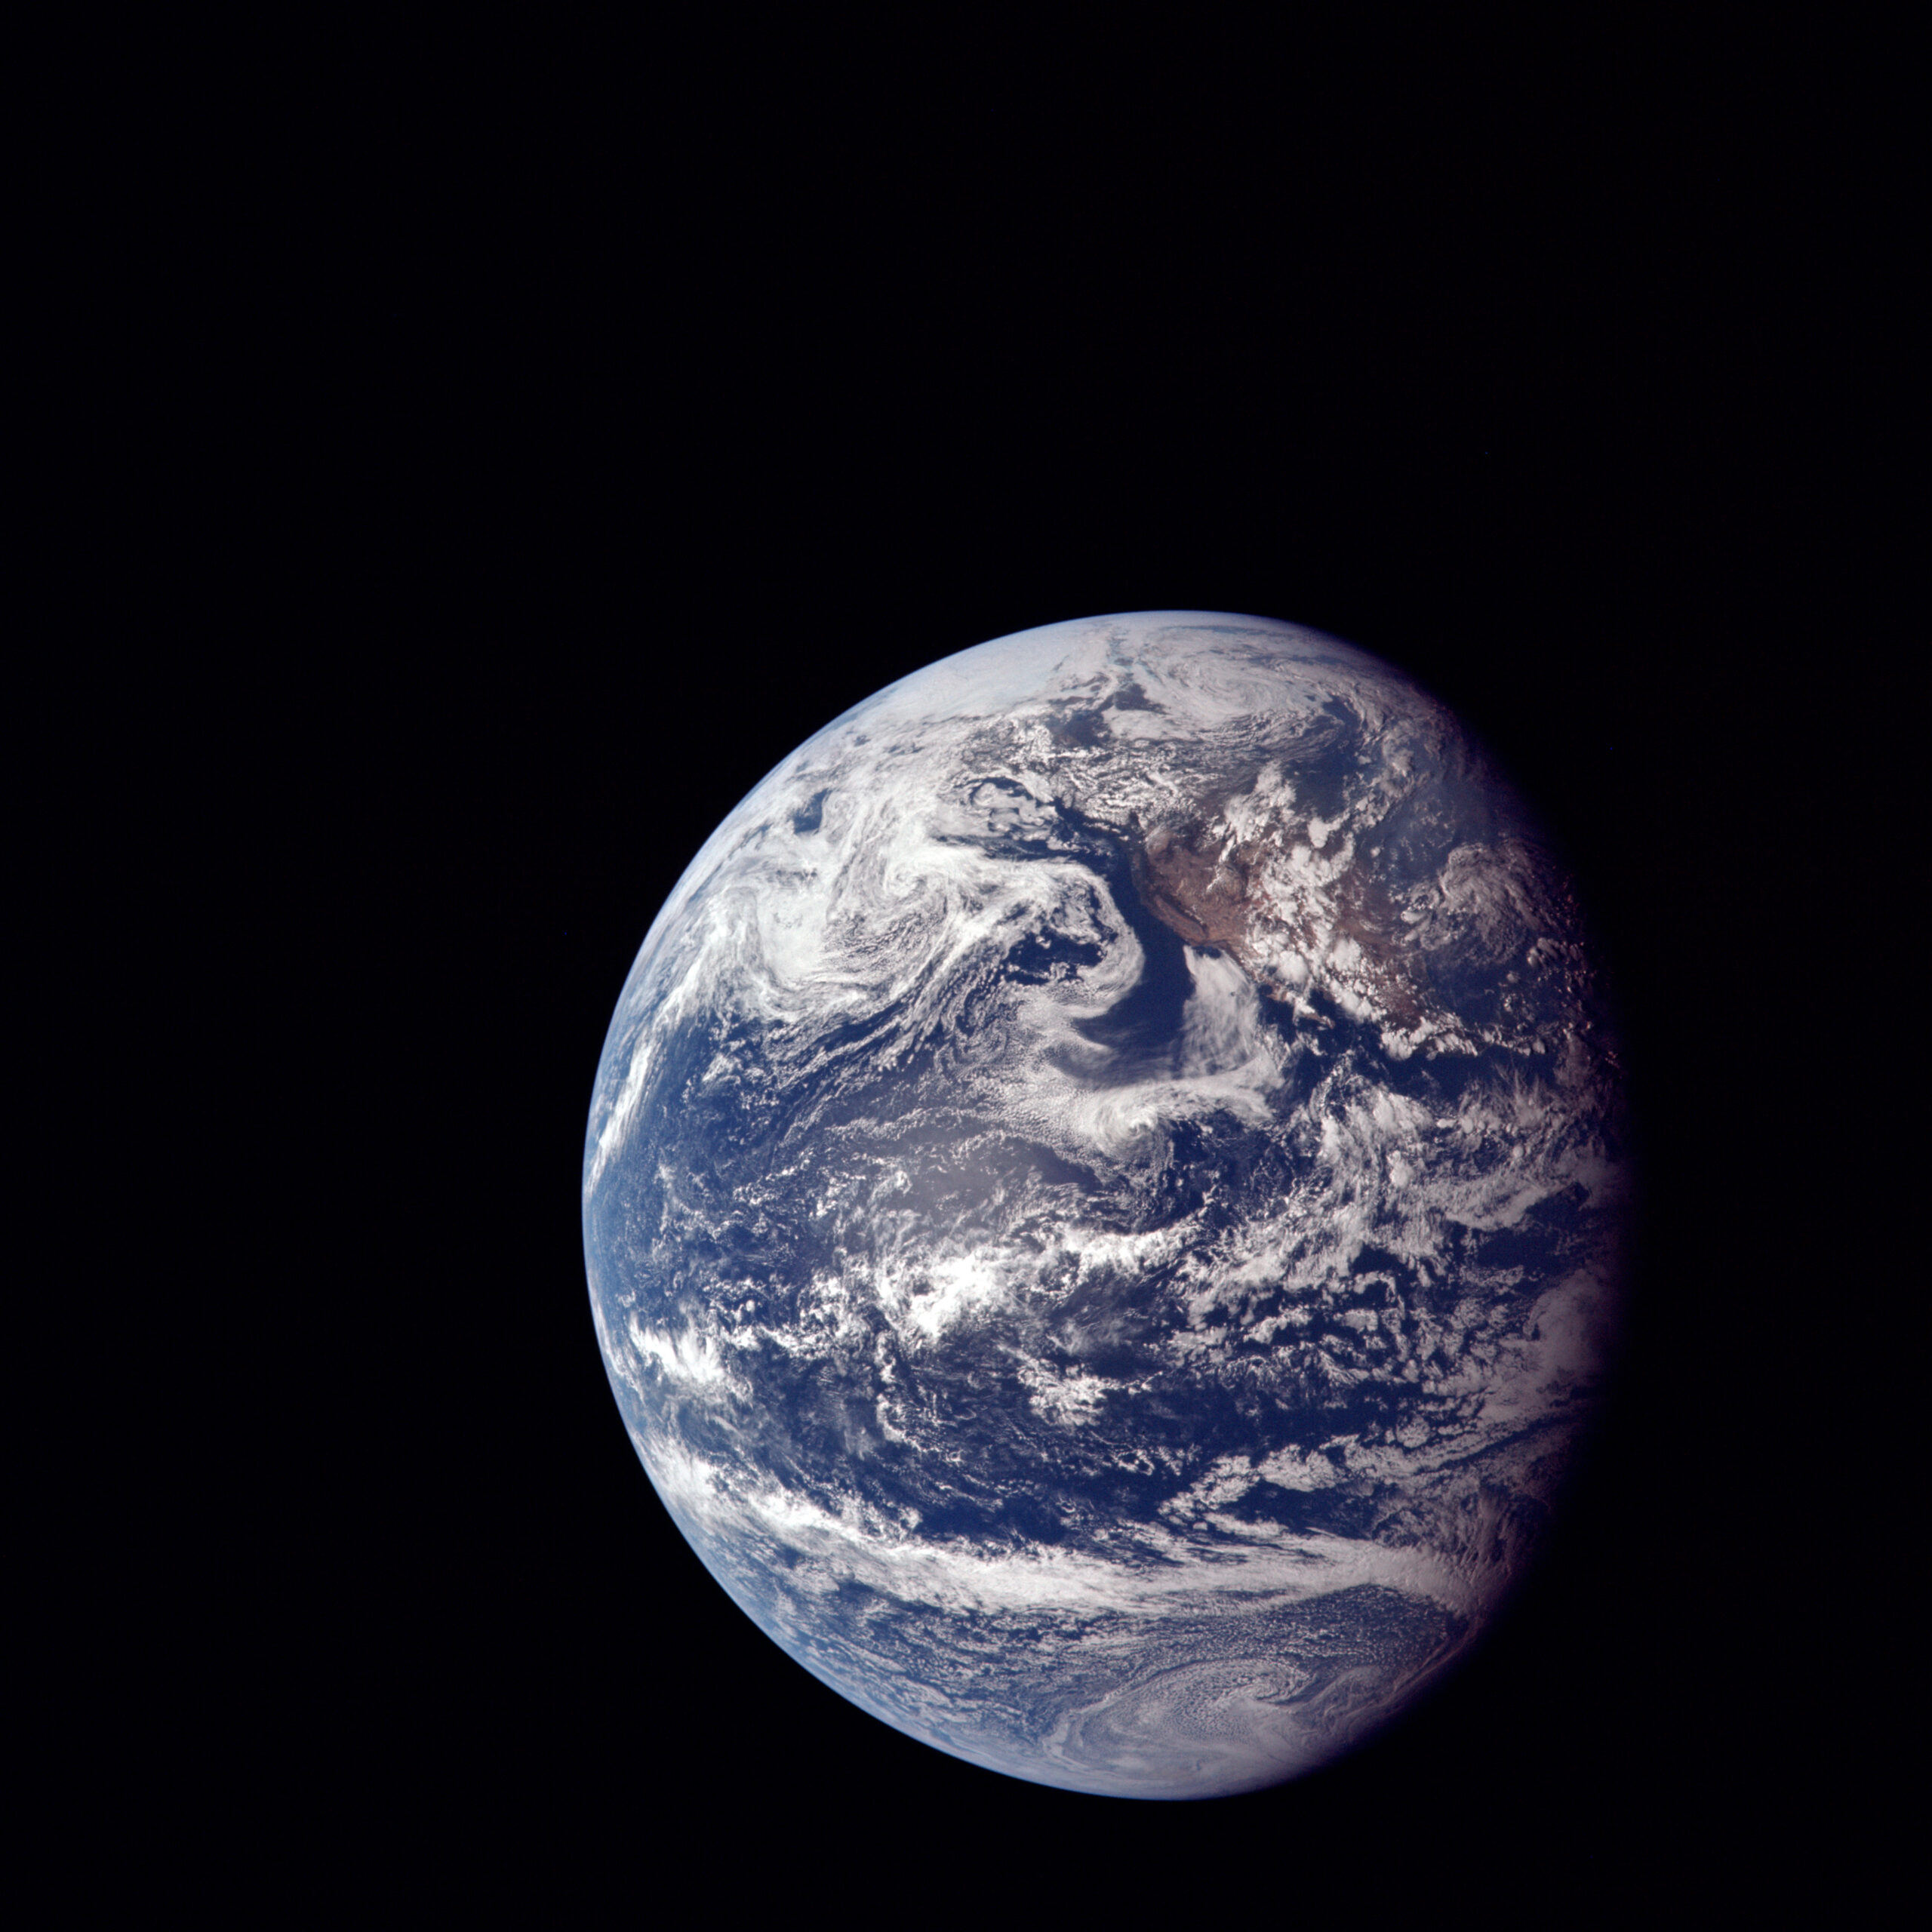
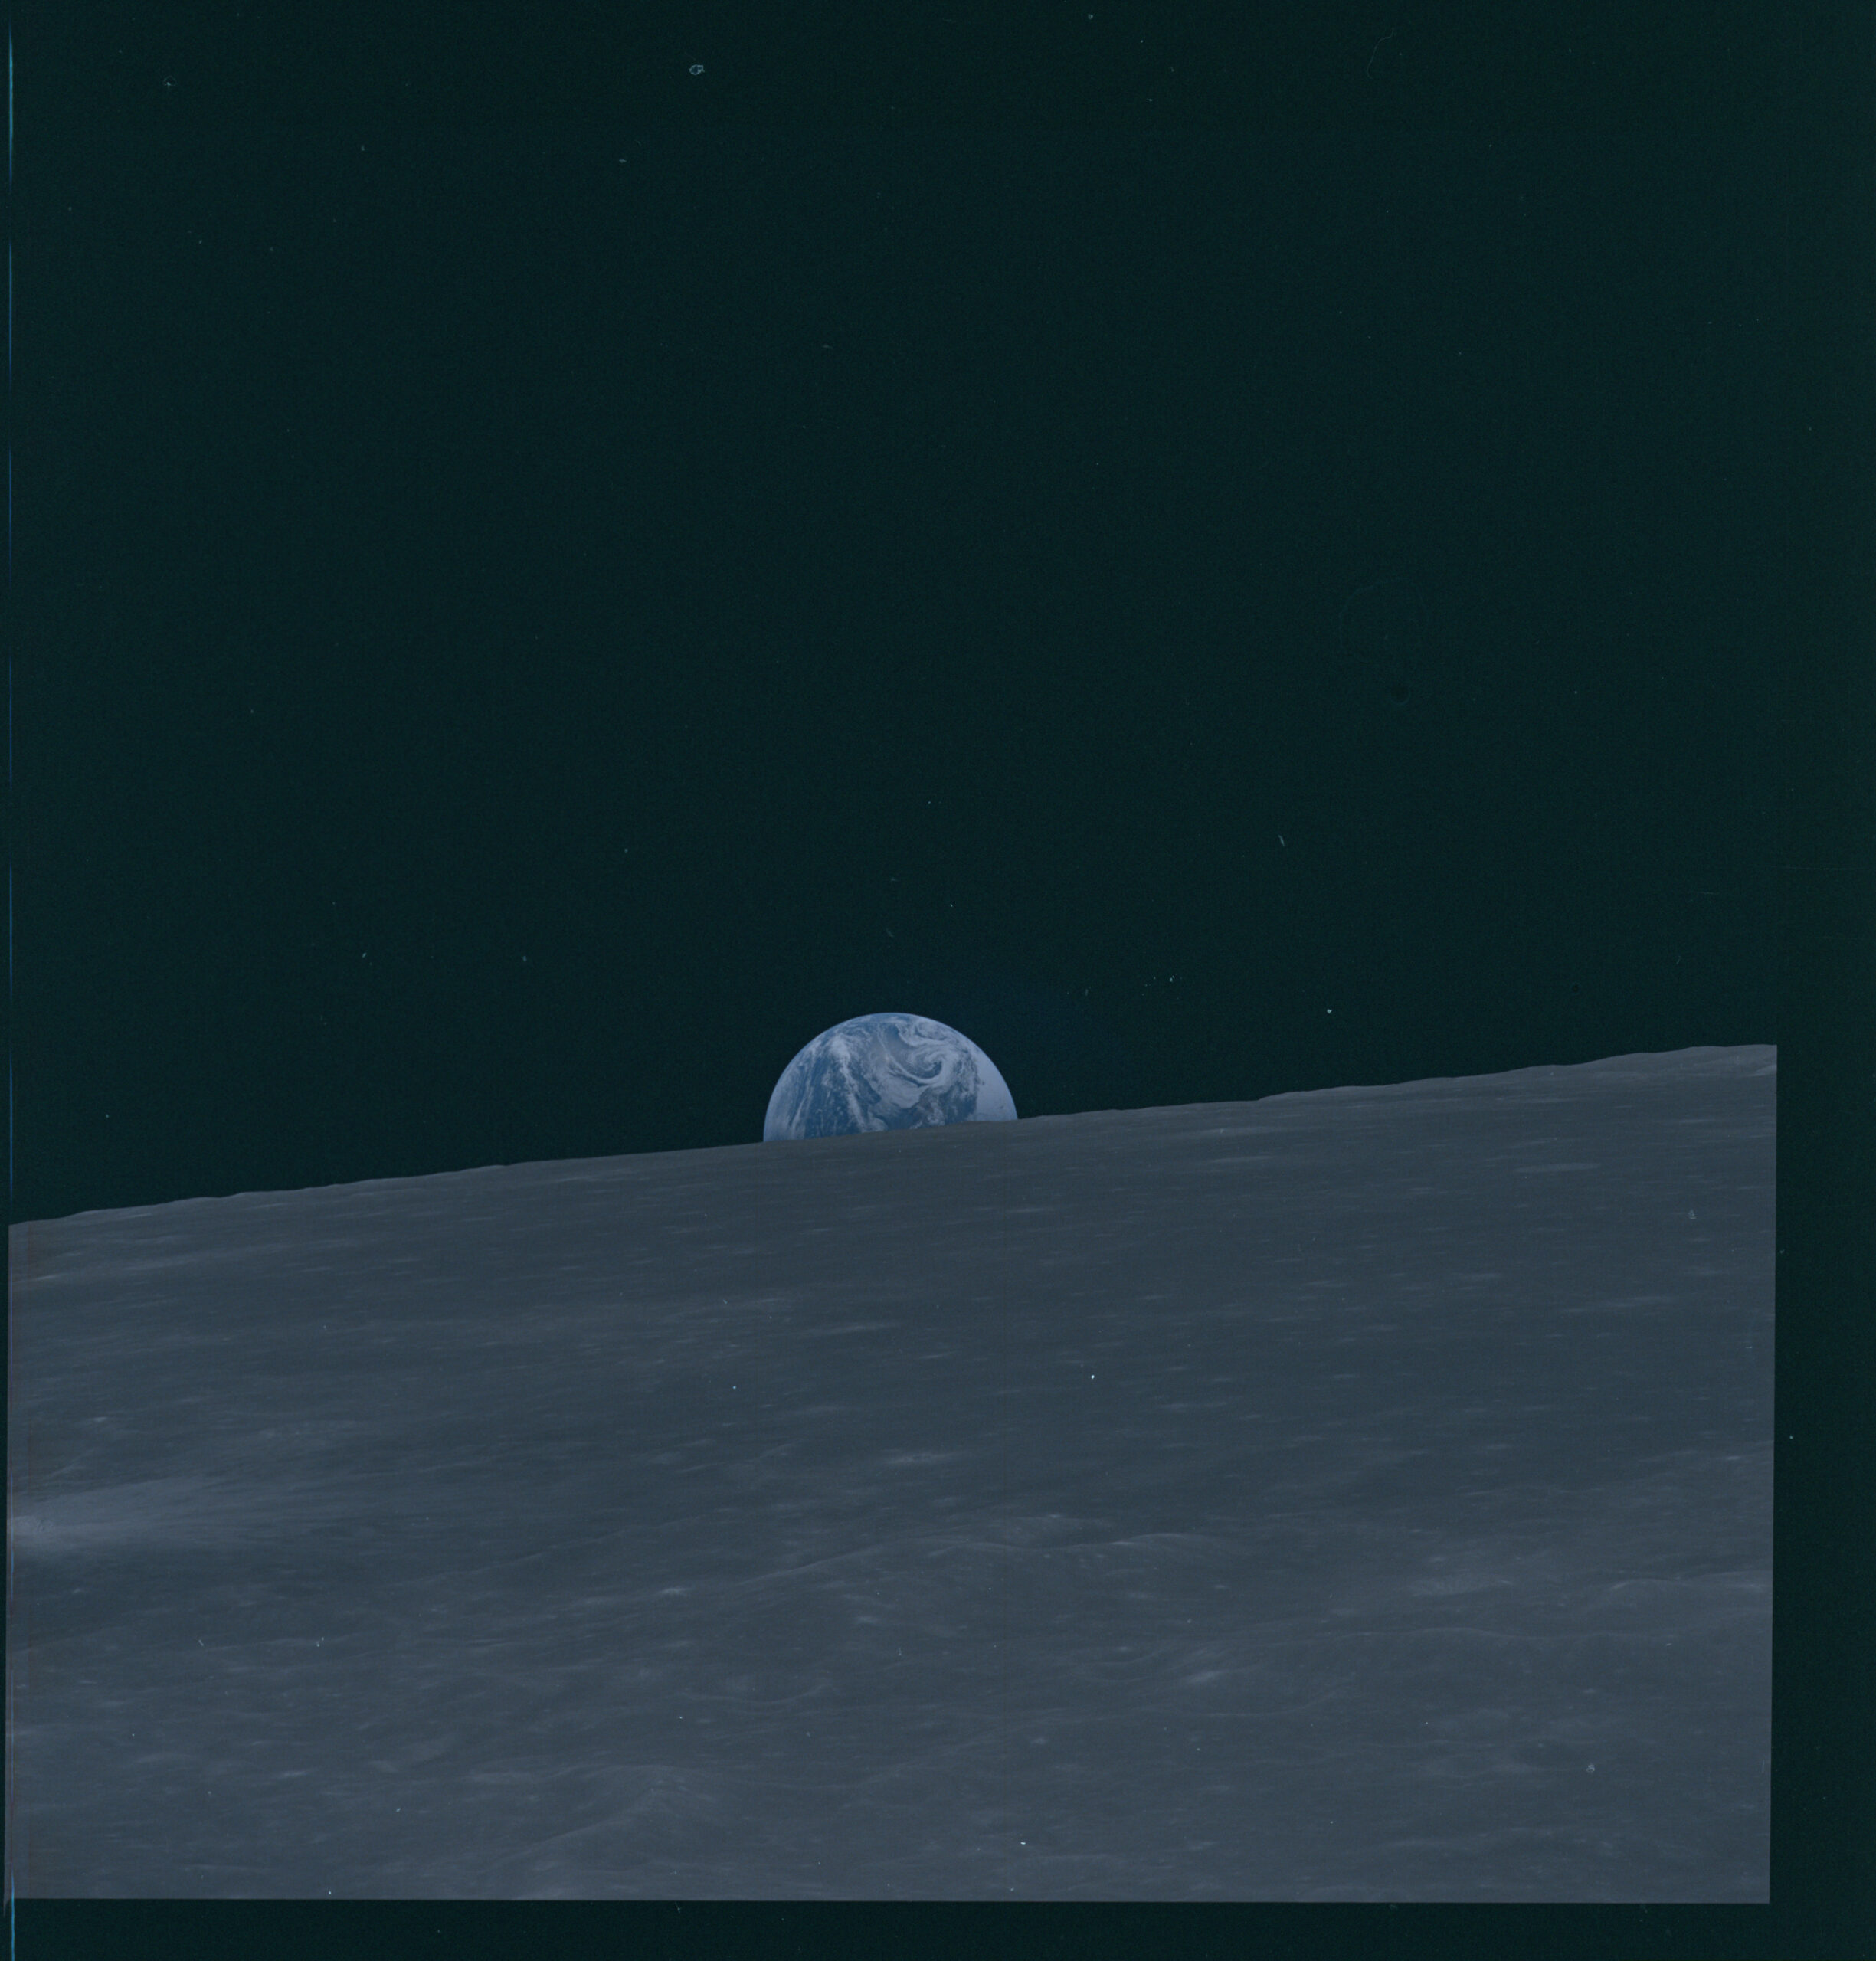
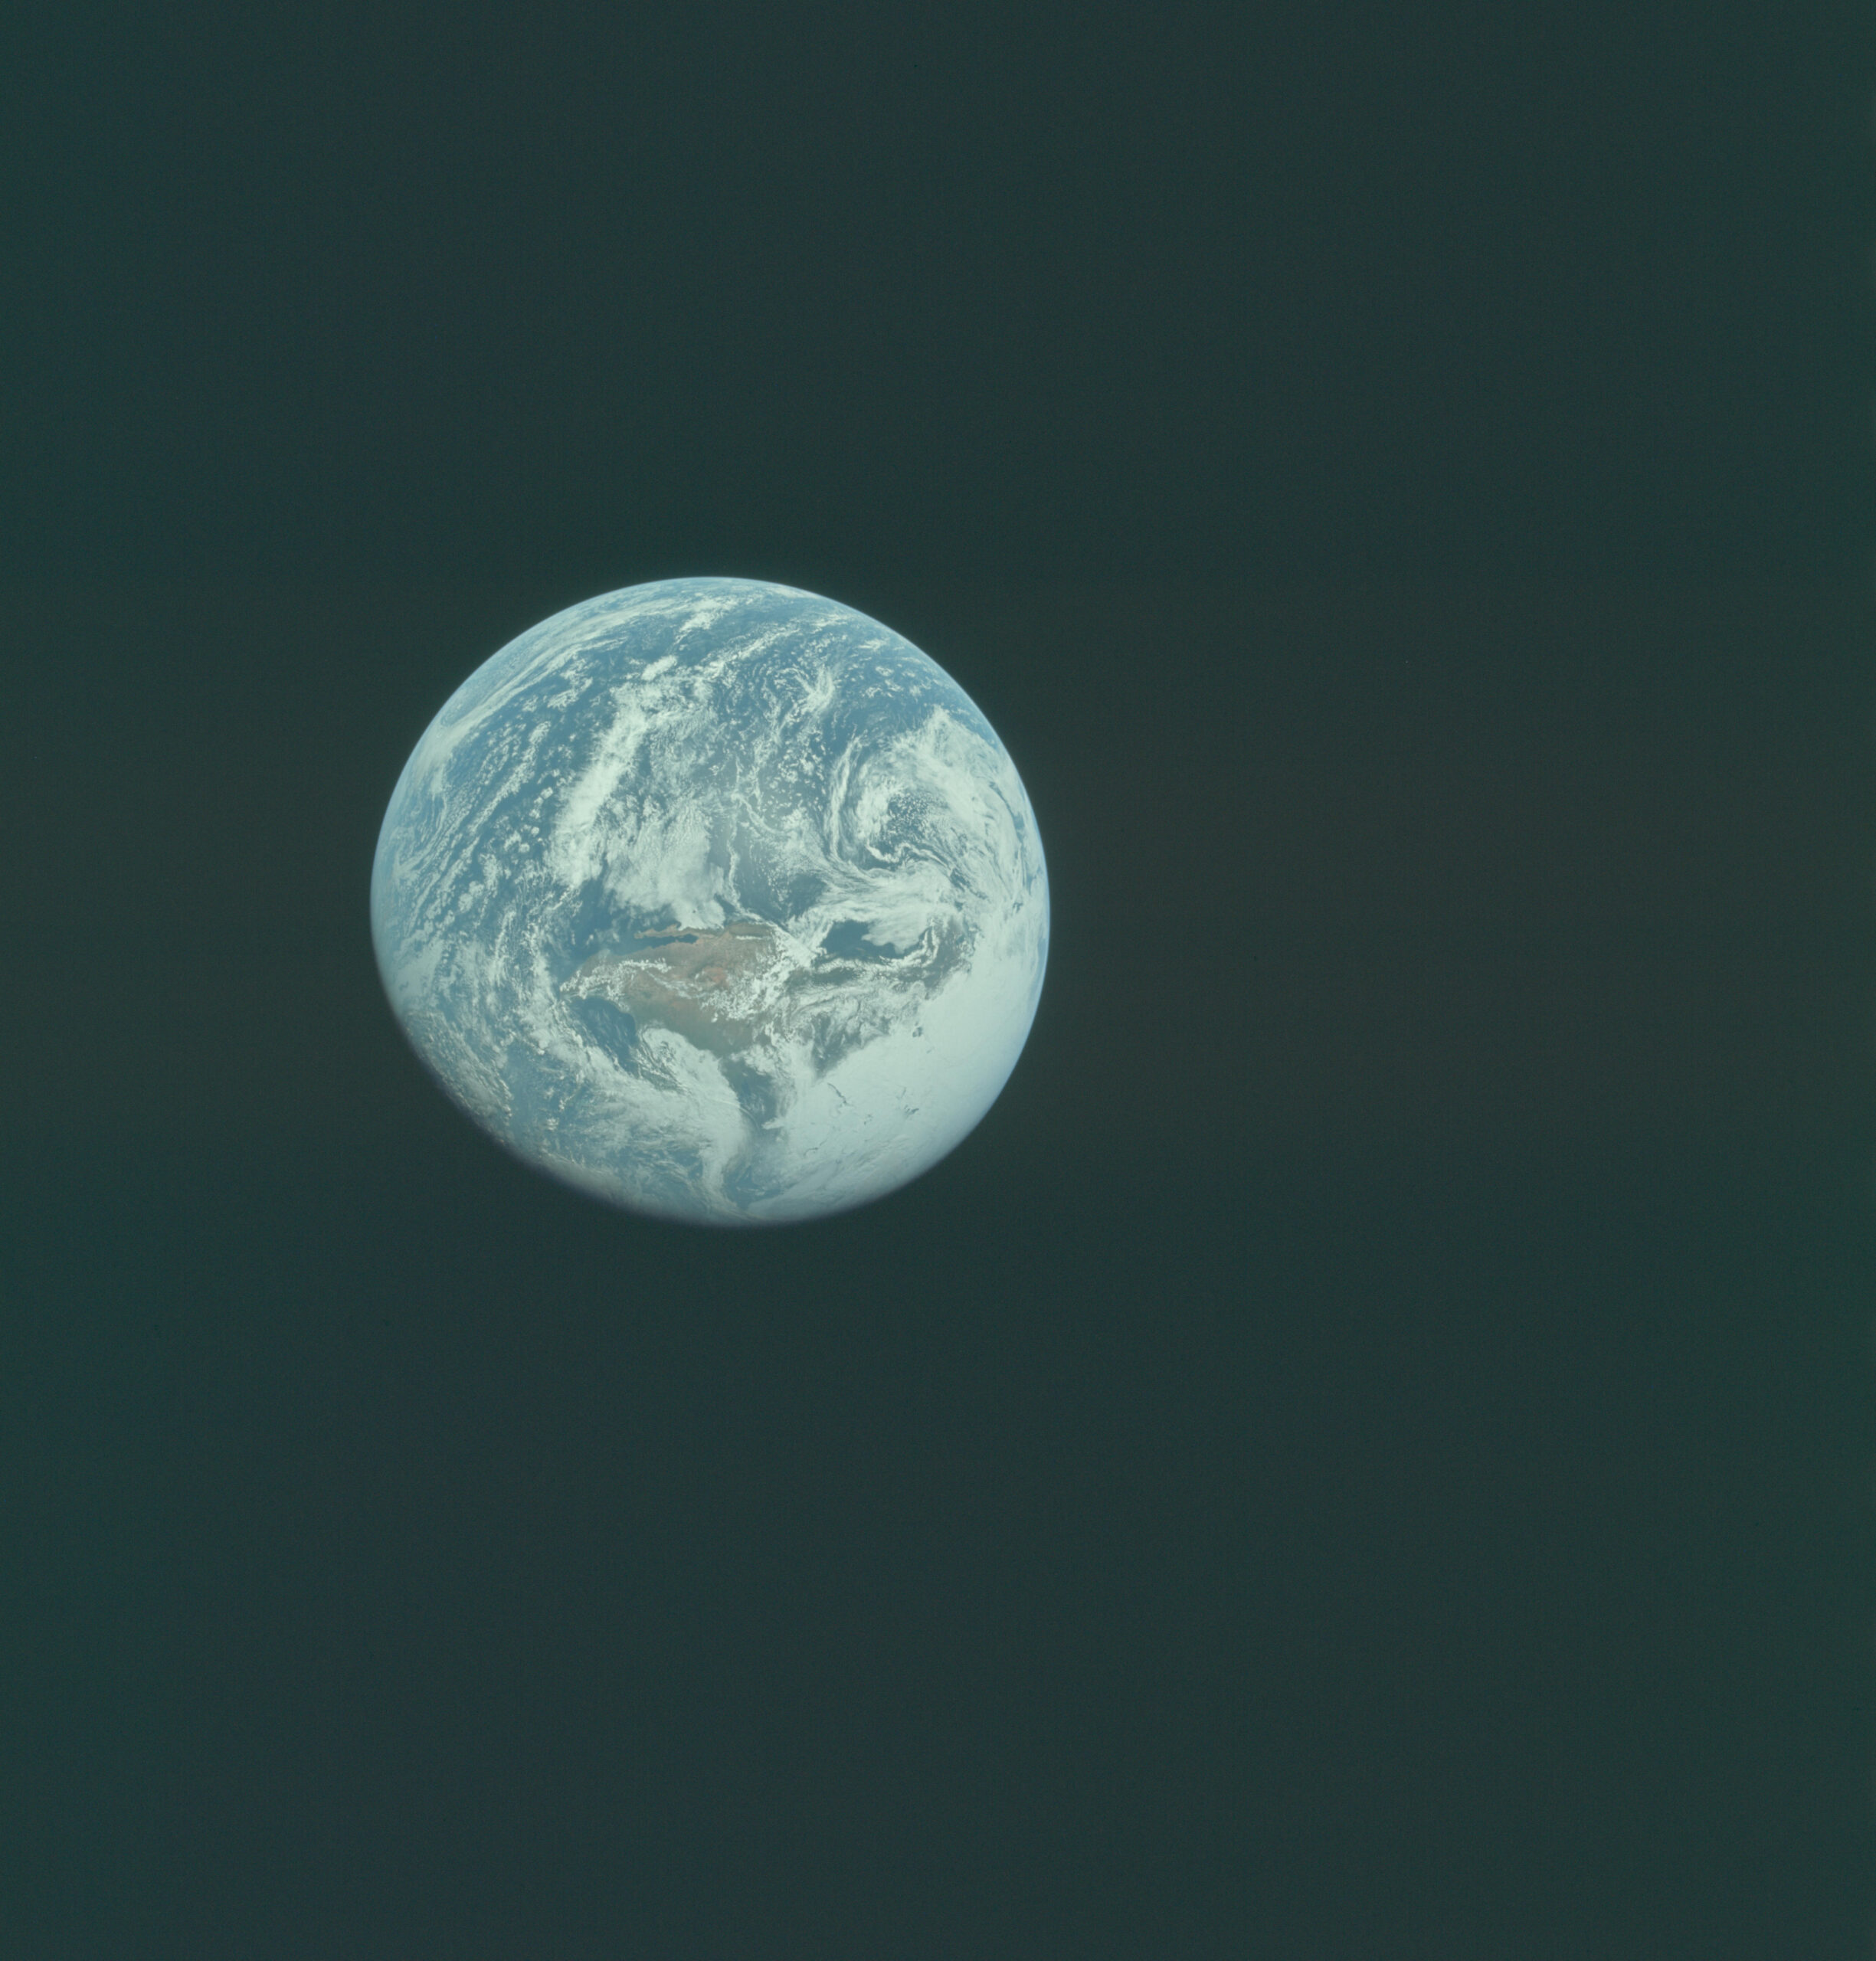
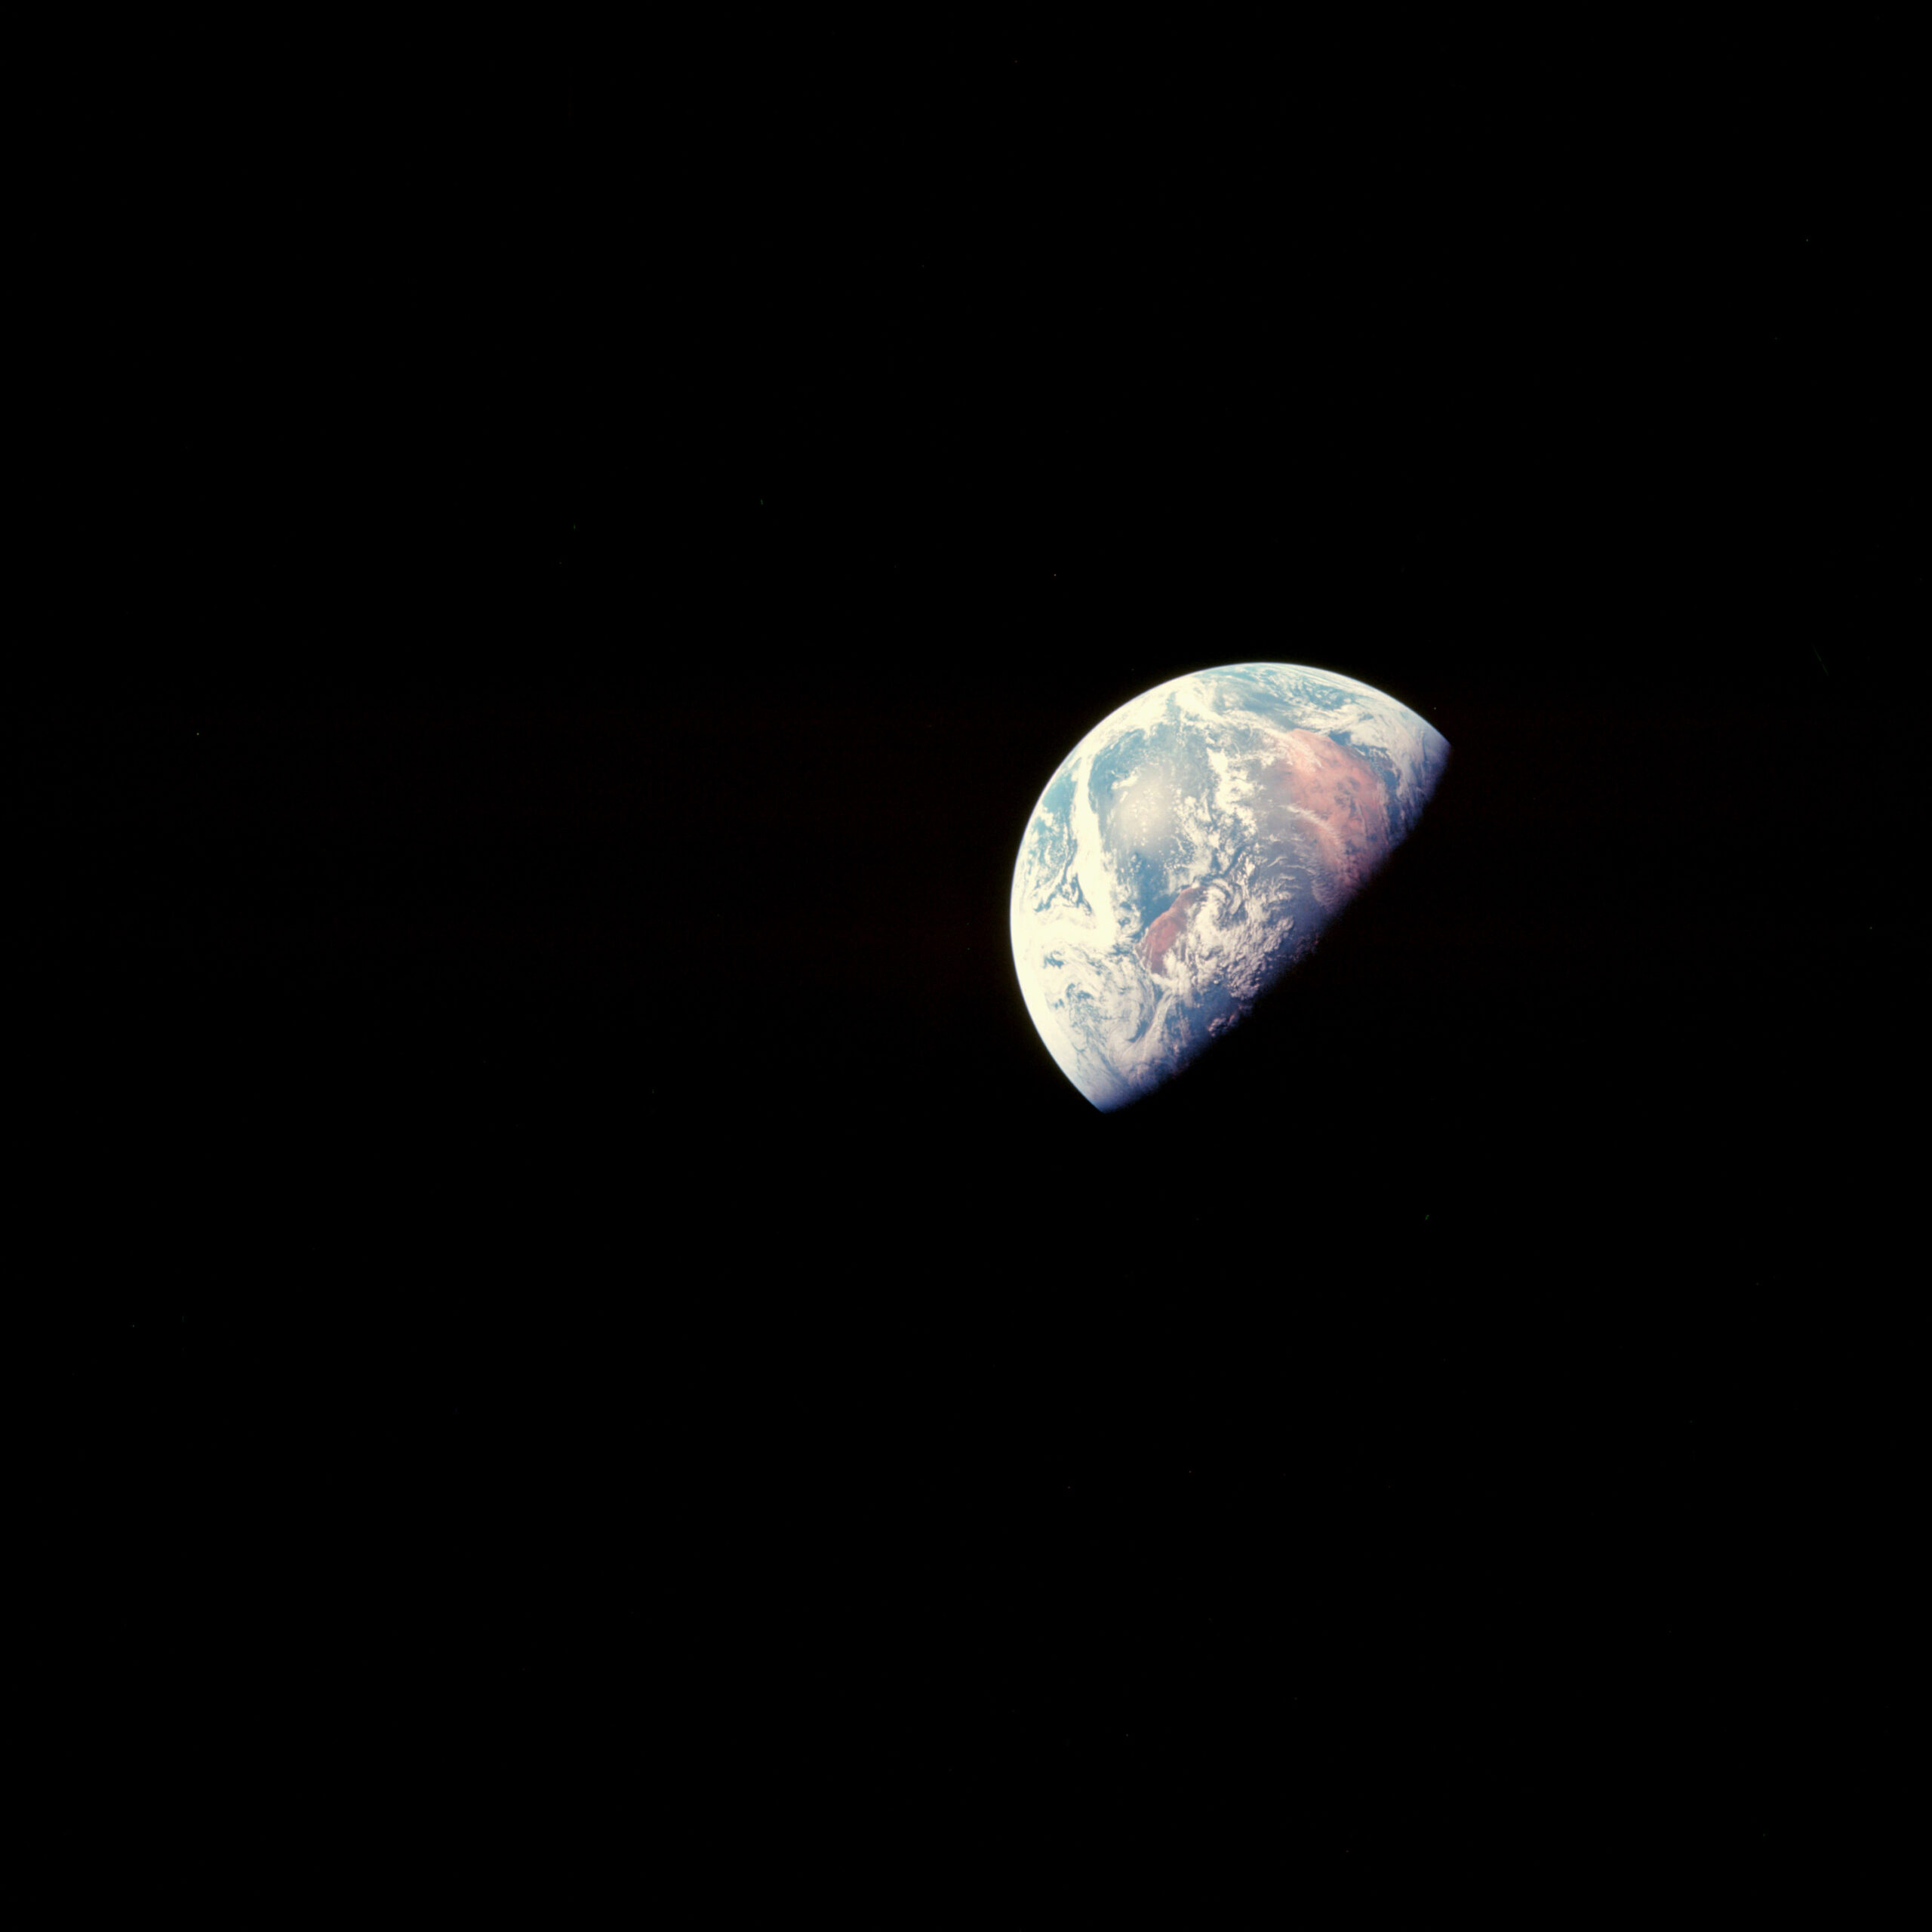
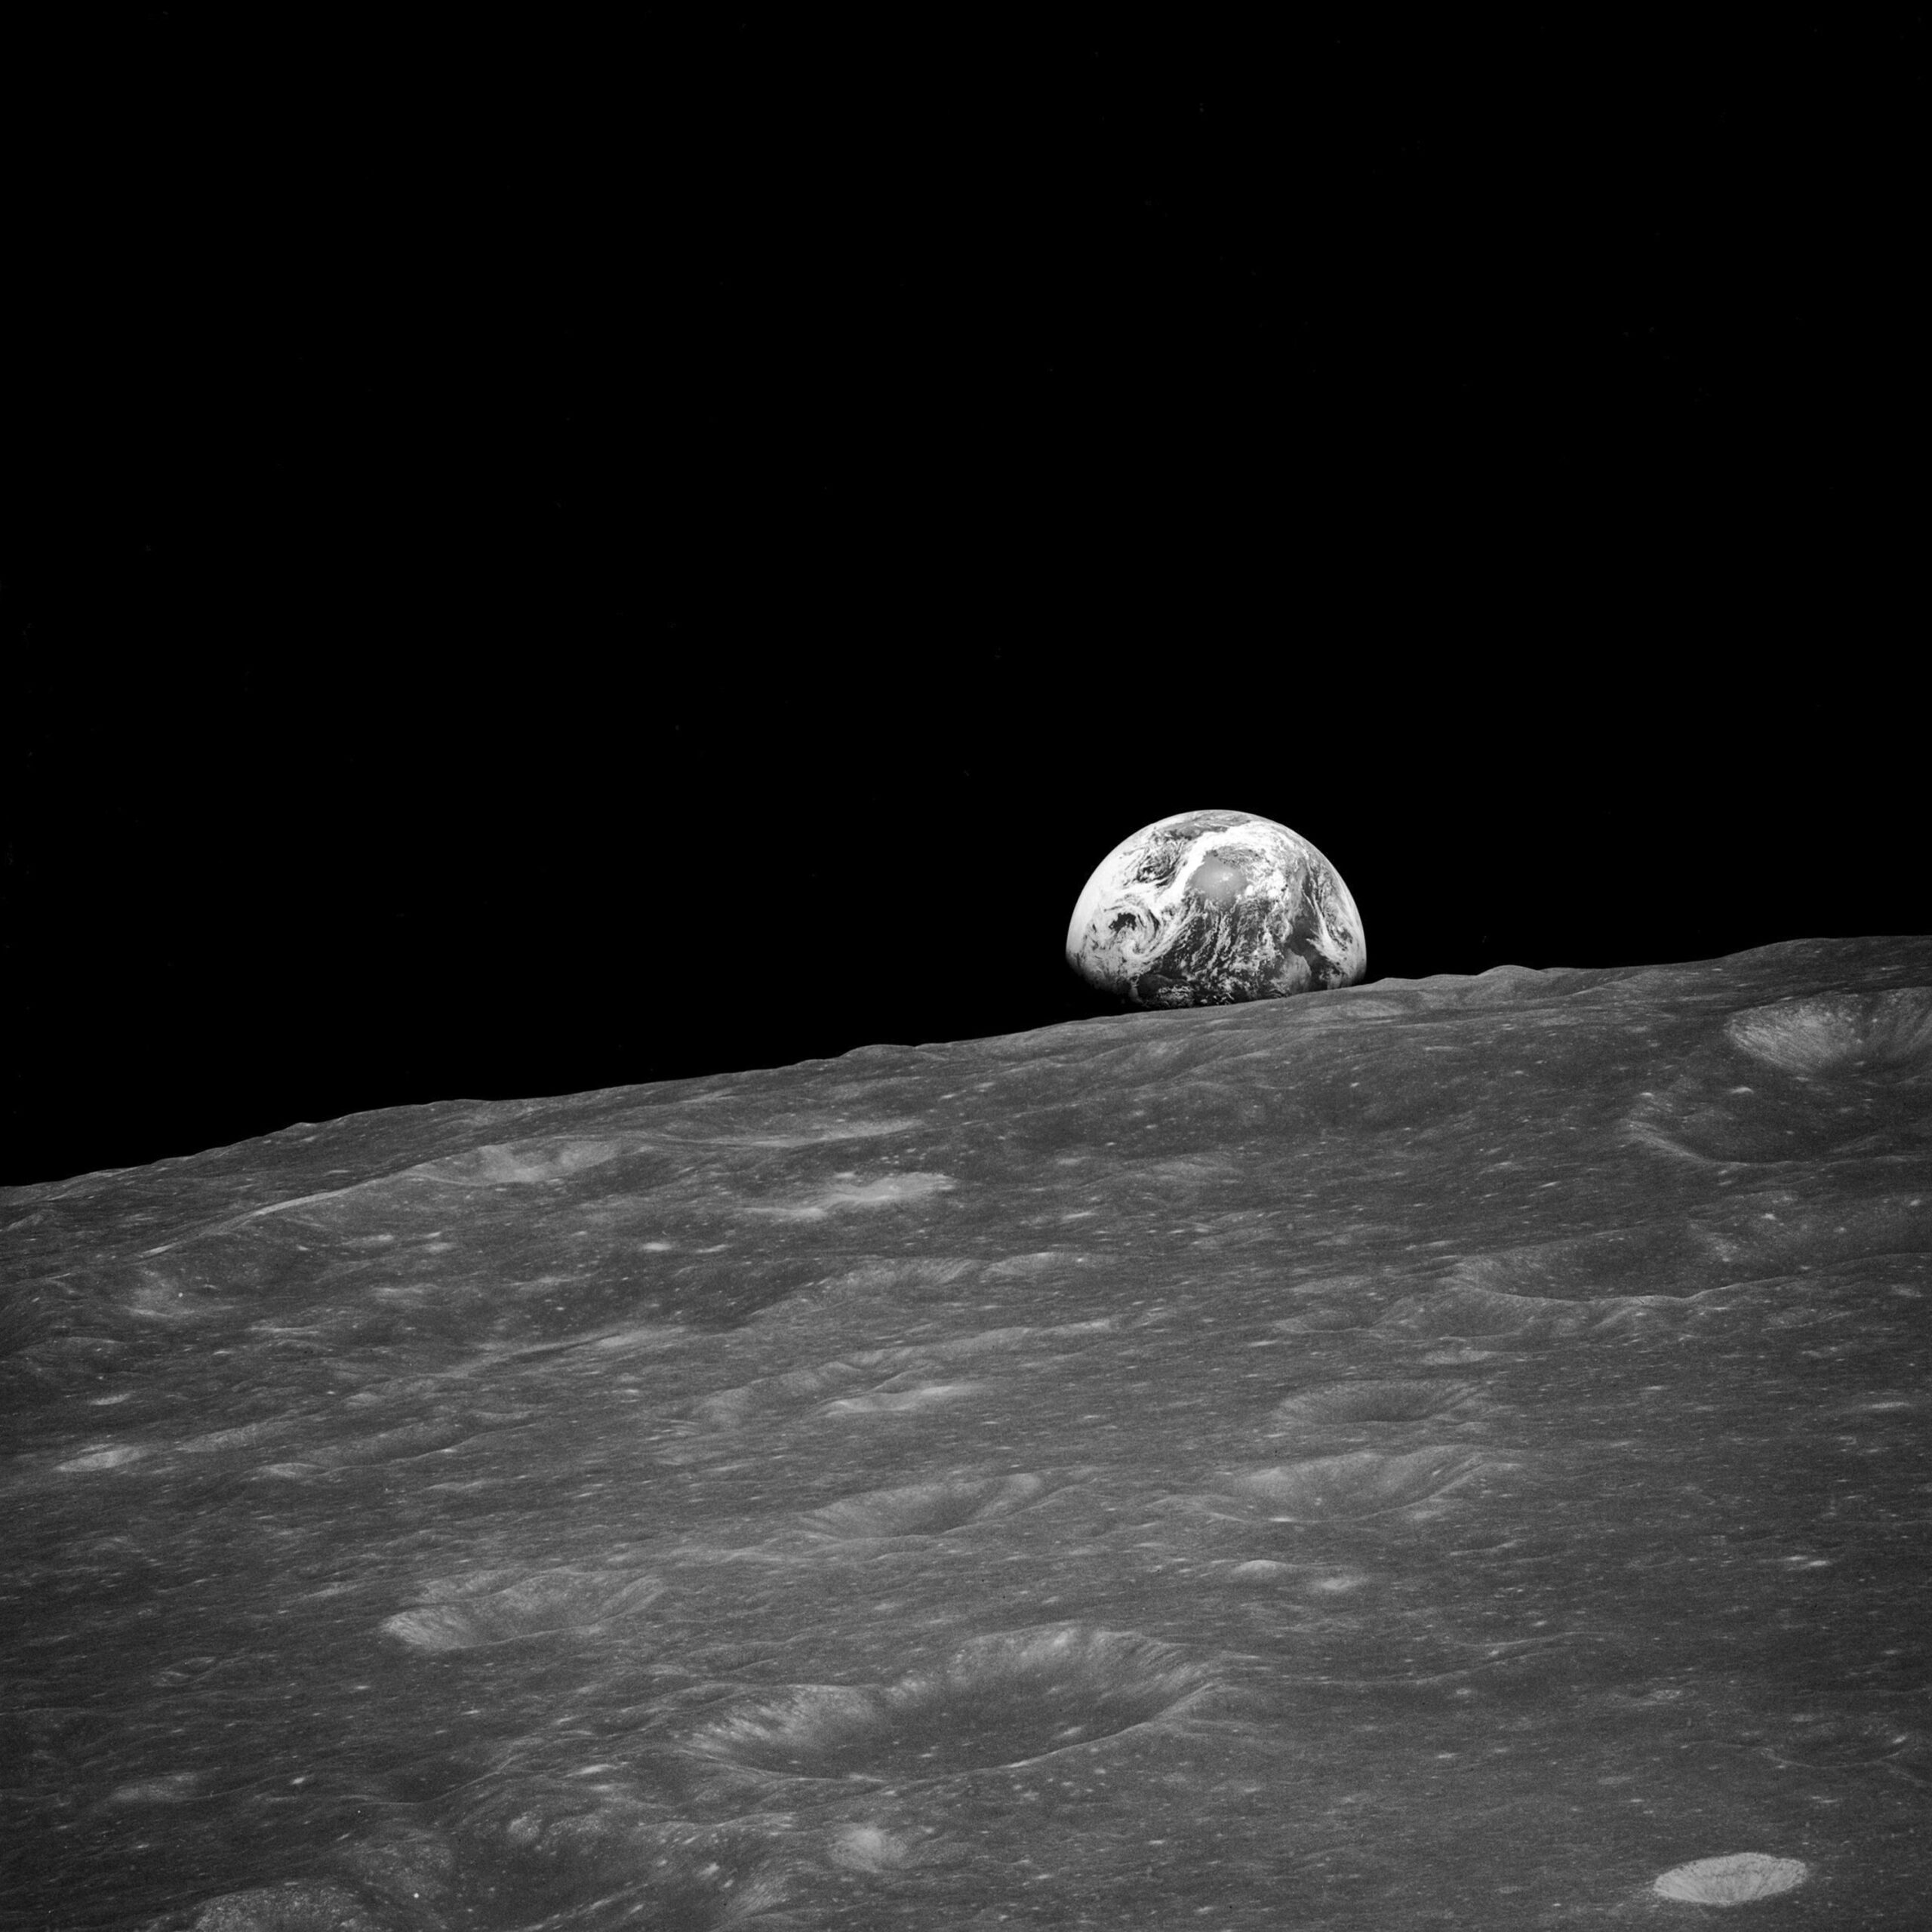
Credits : NASA / Apollo crews
And a selection of photos taken during mission 58 aboard the ISS :
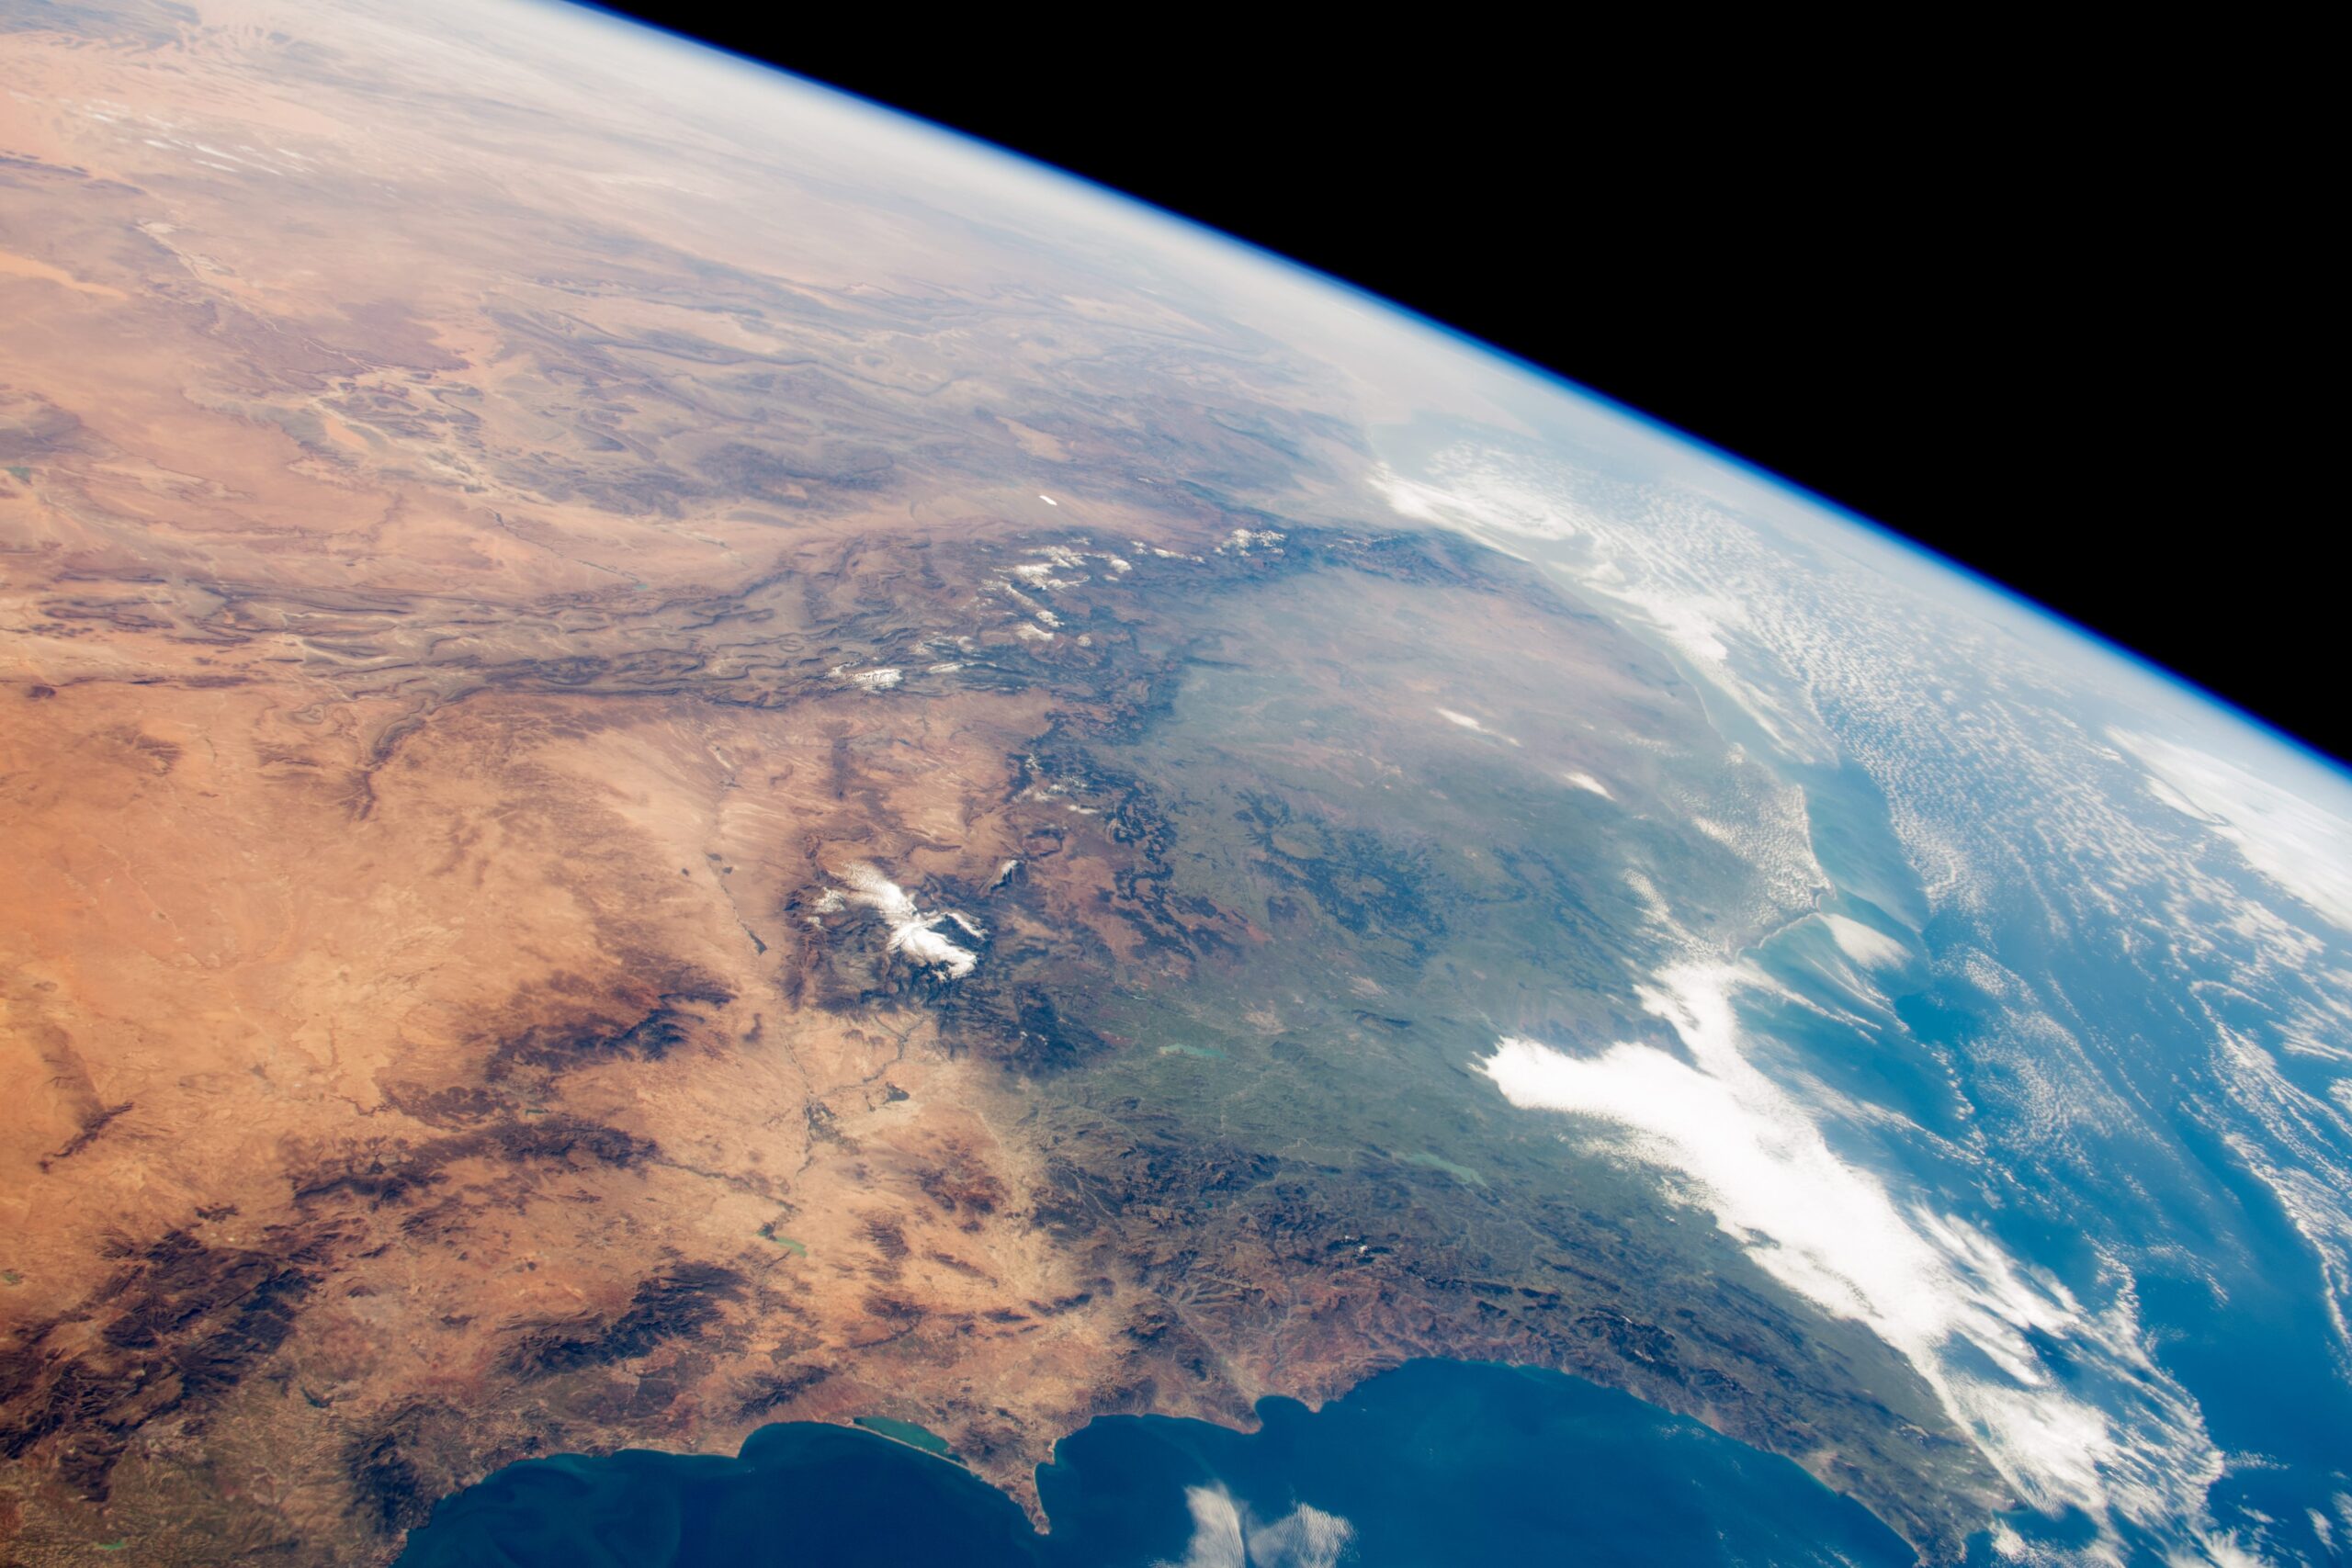
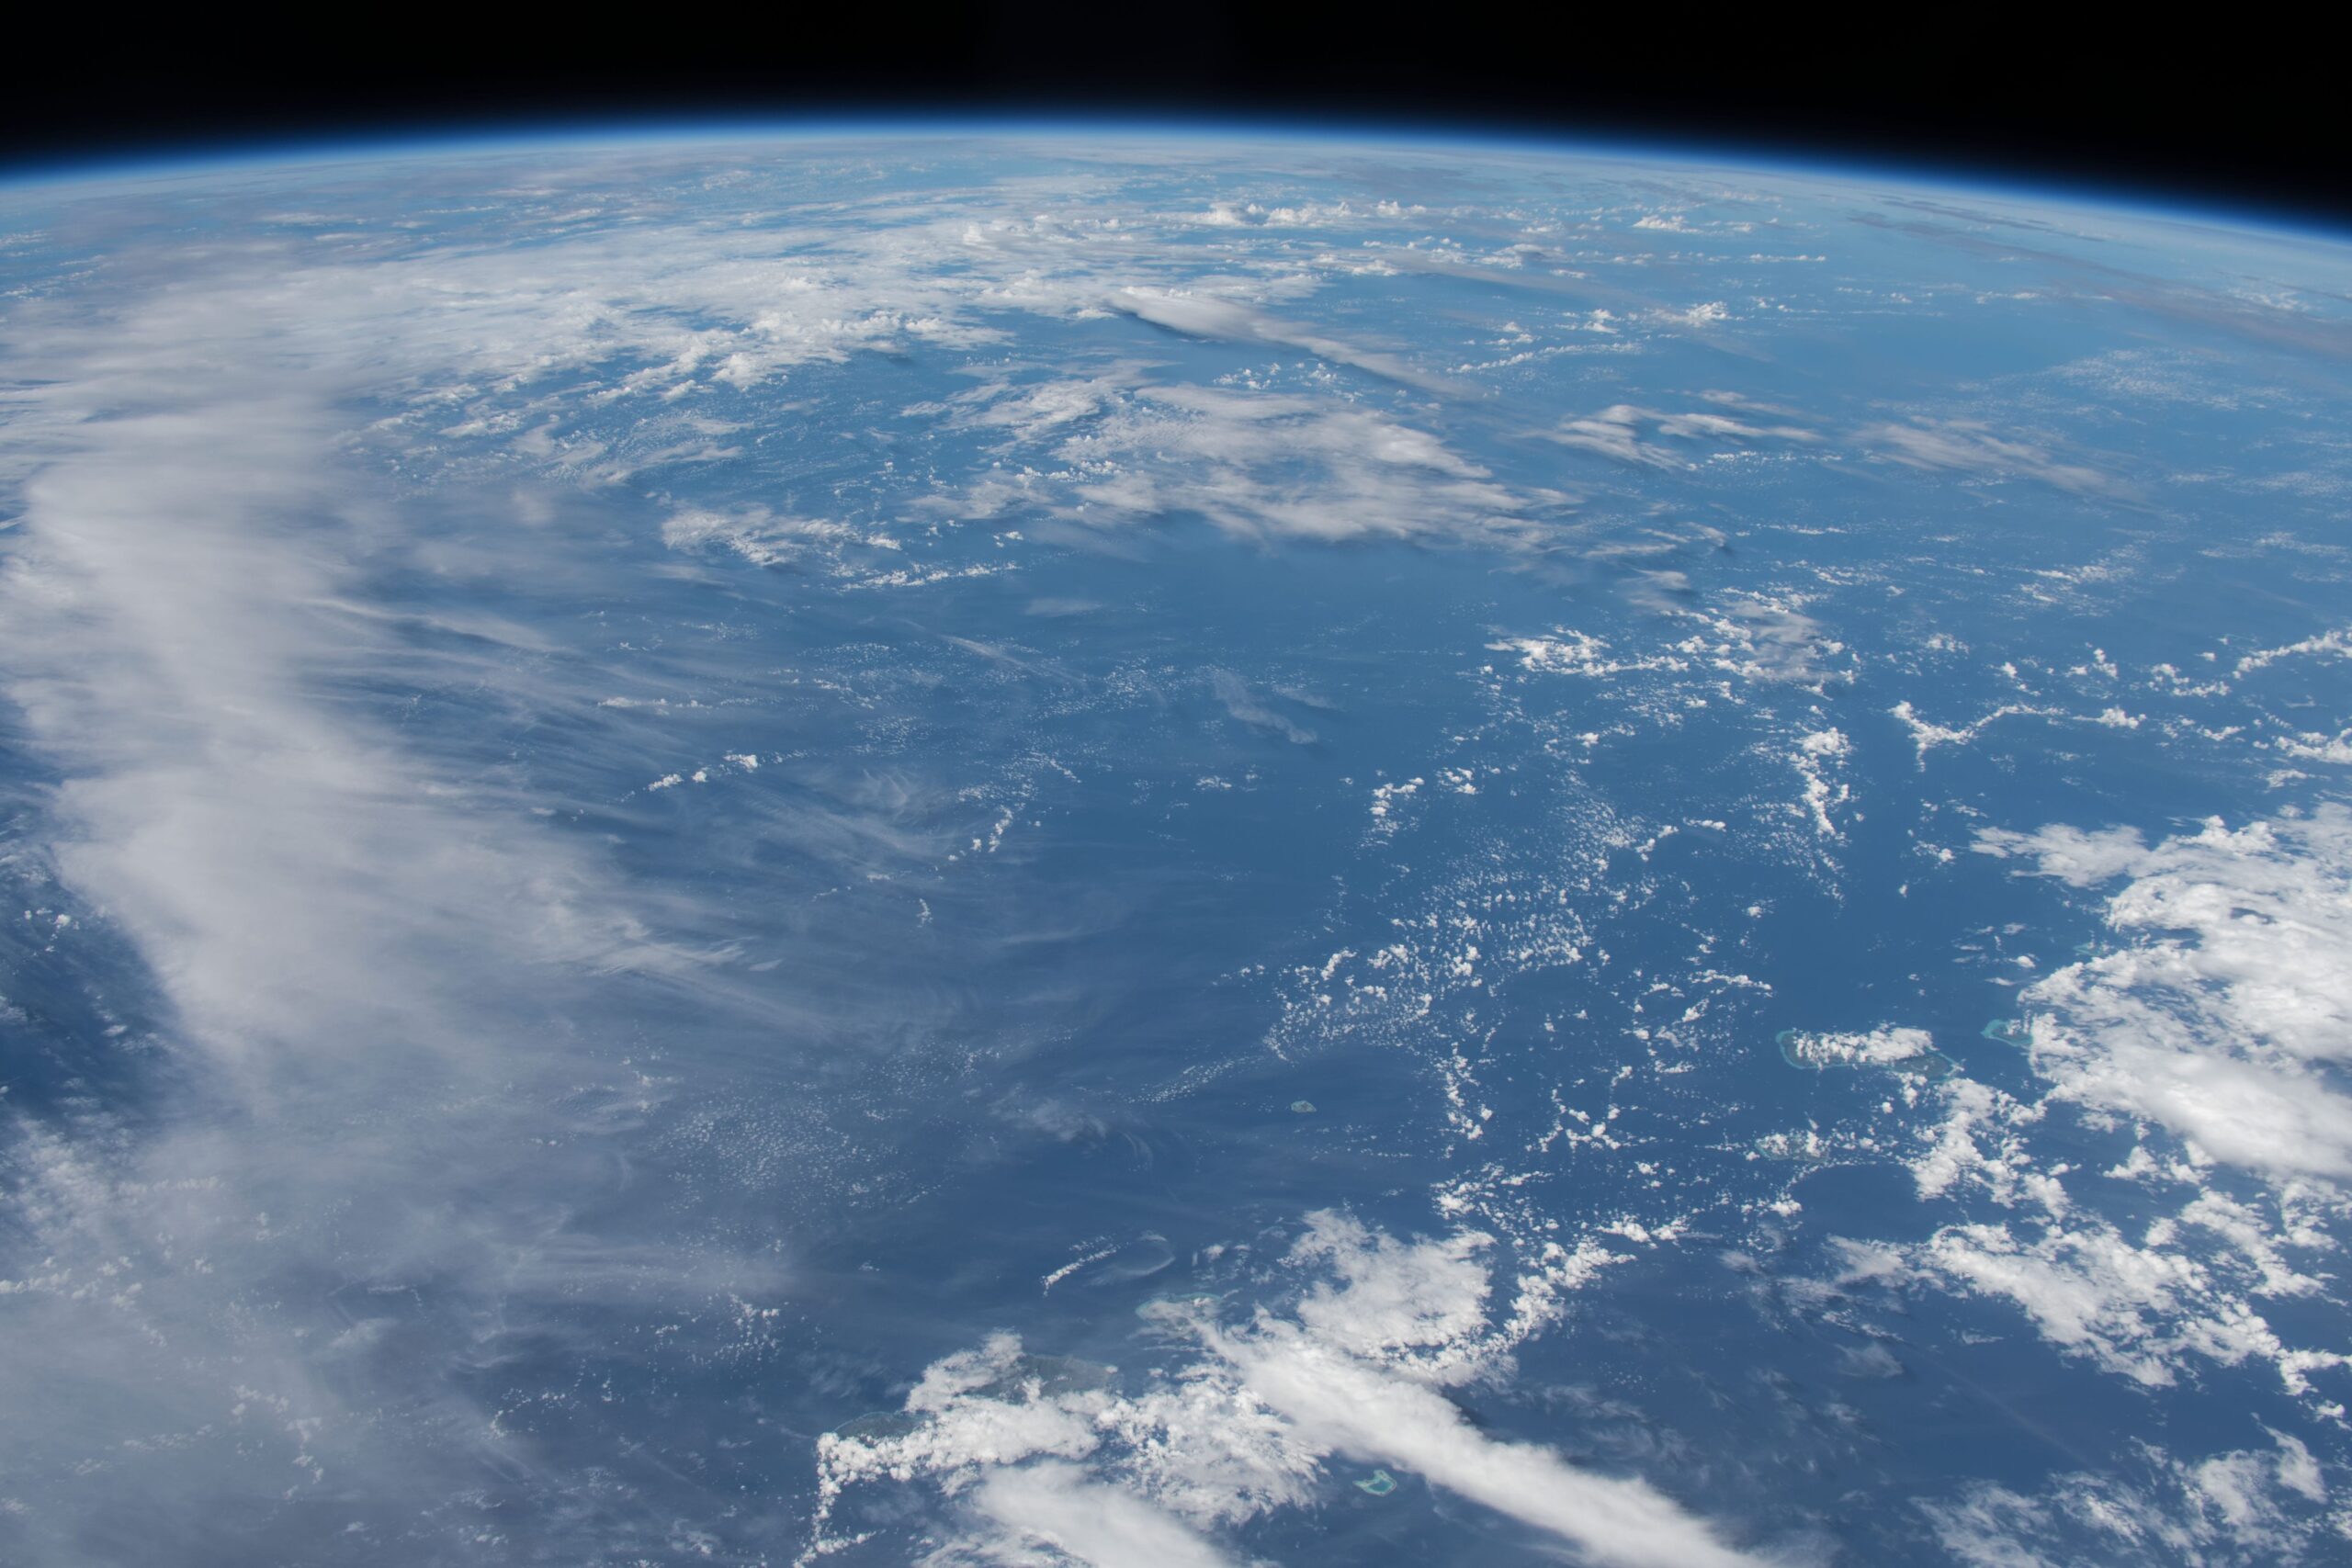
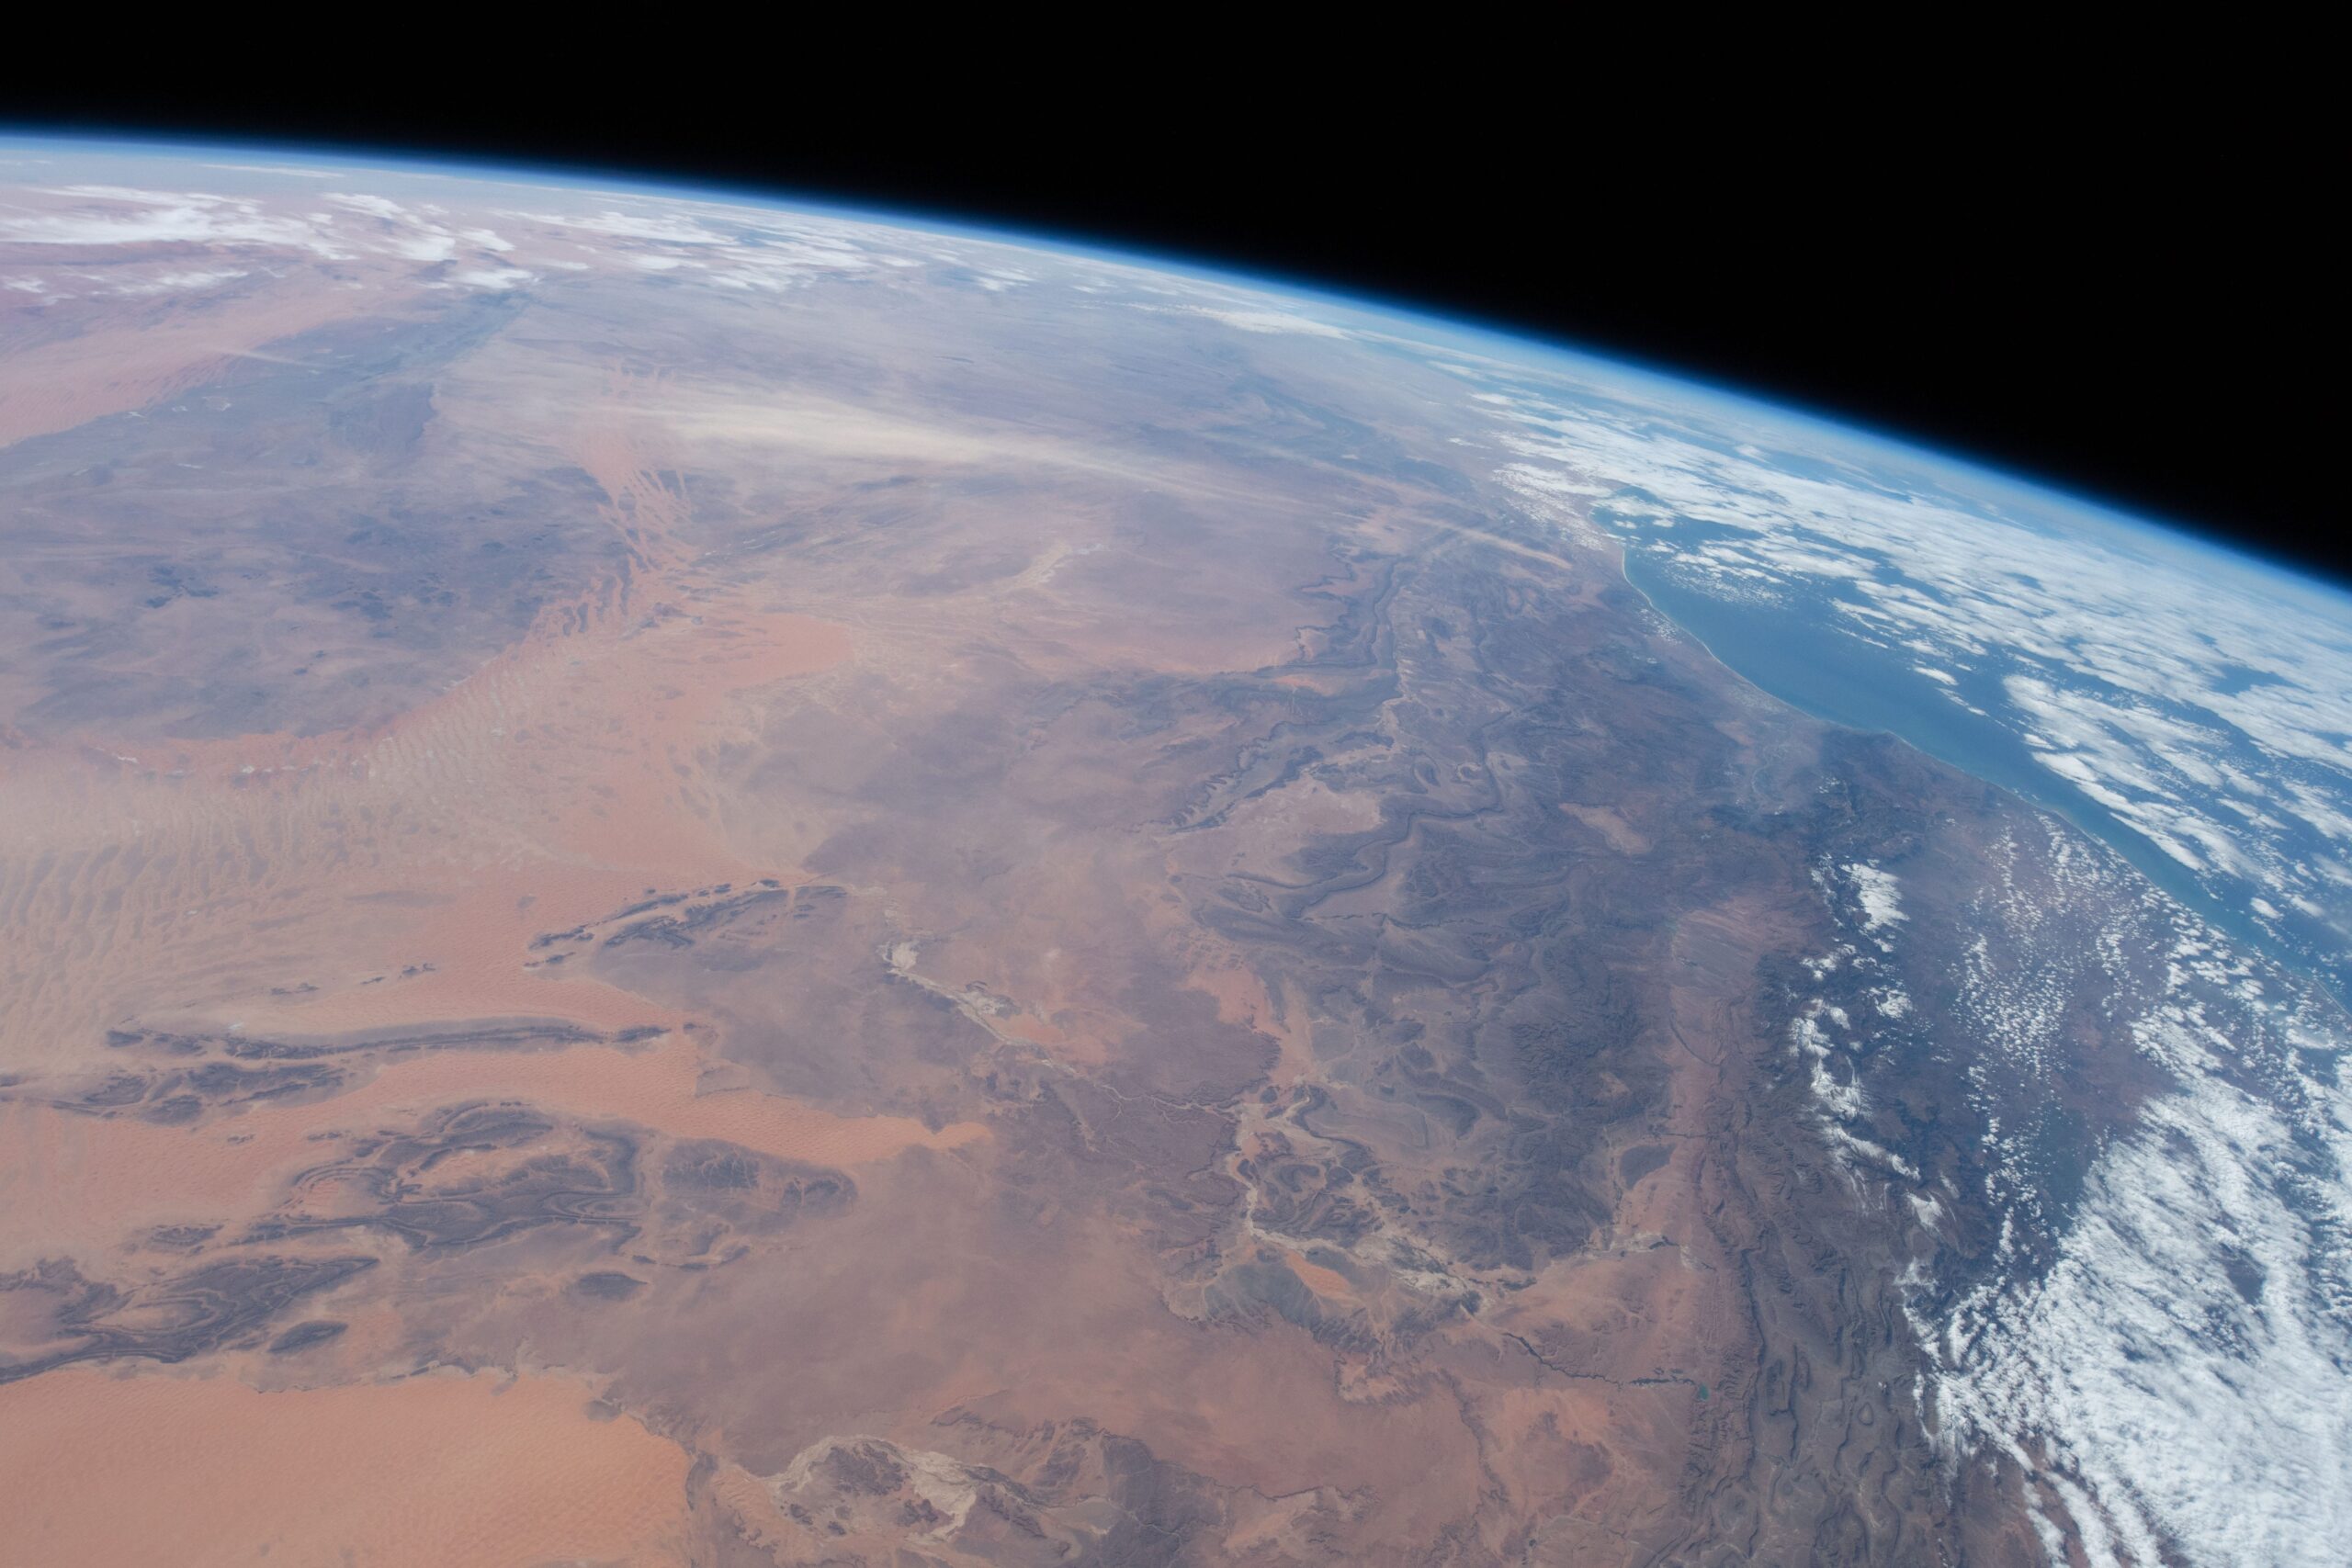
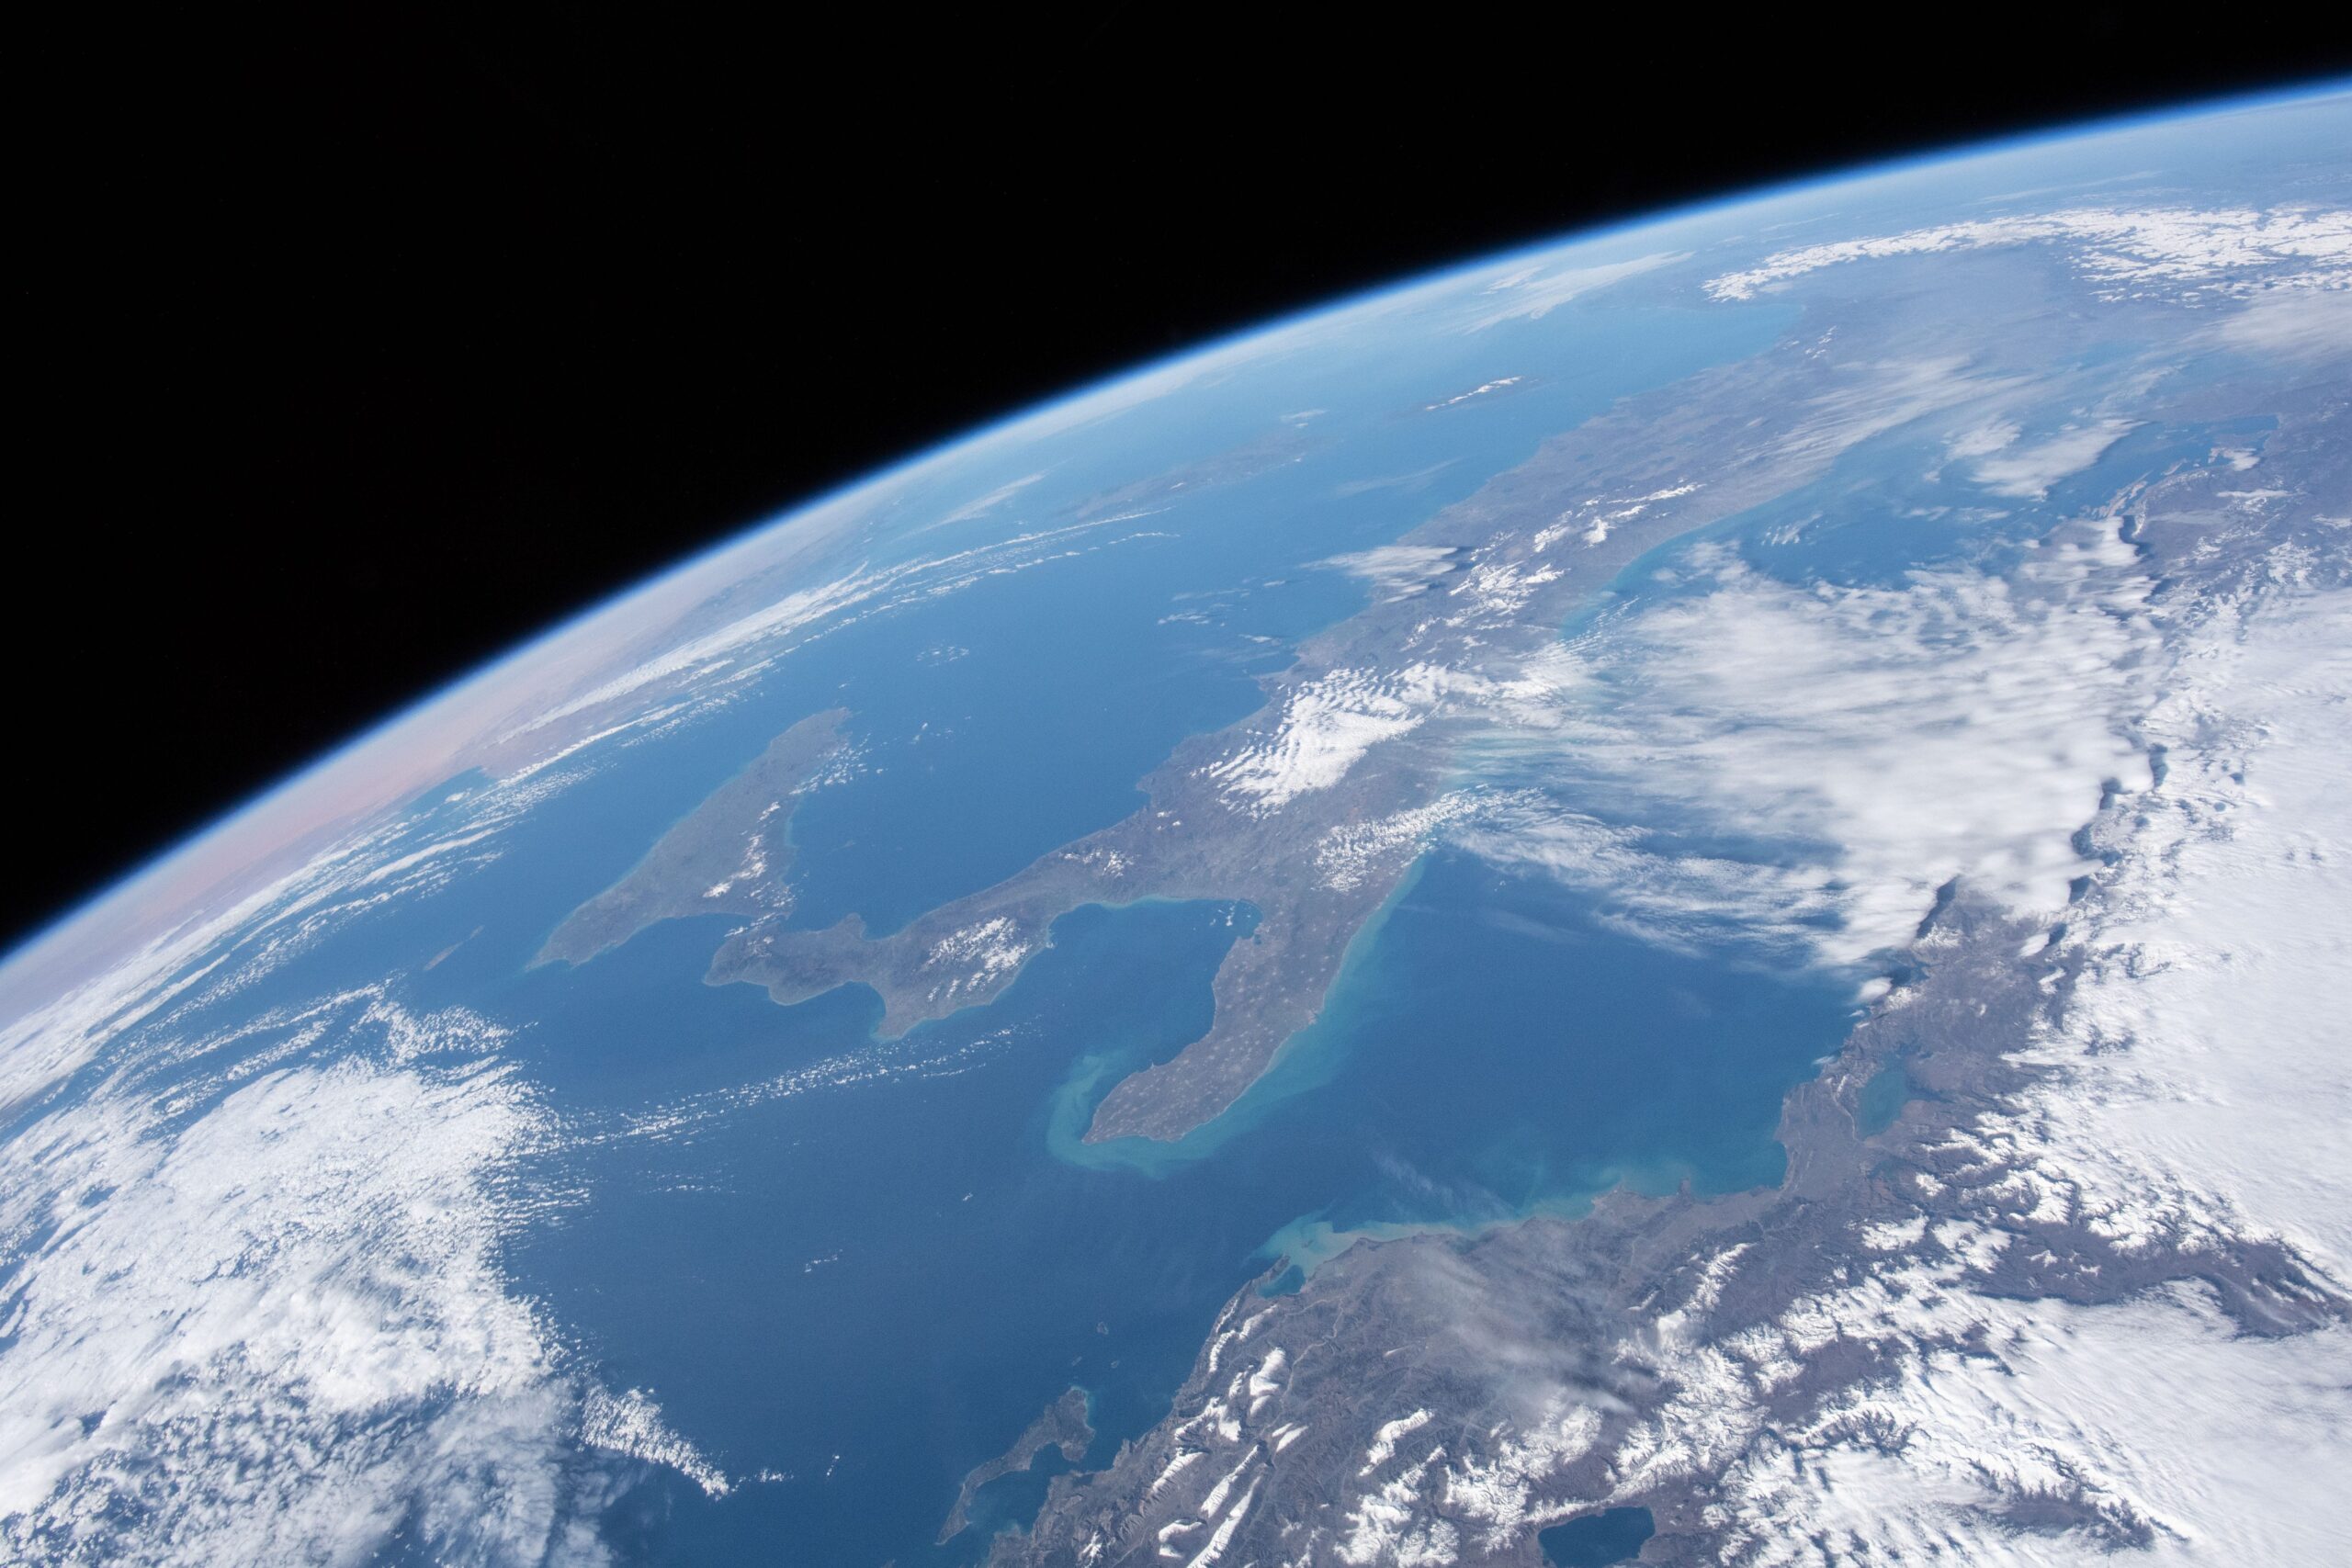
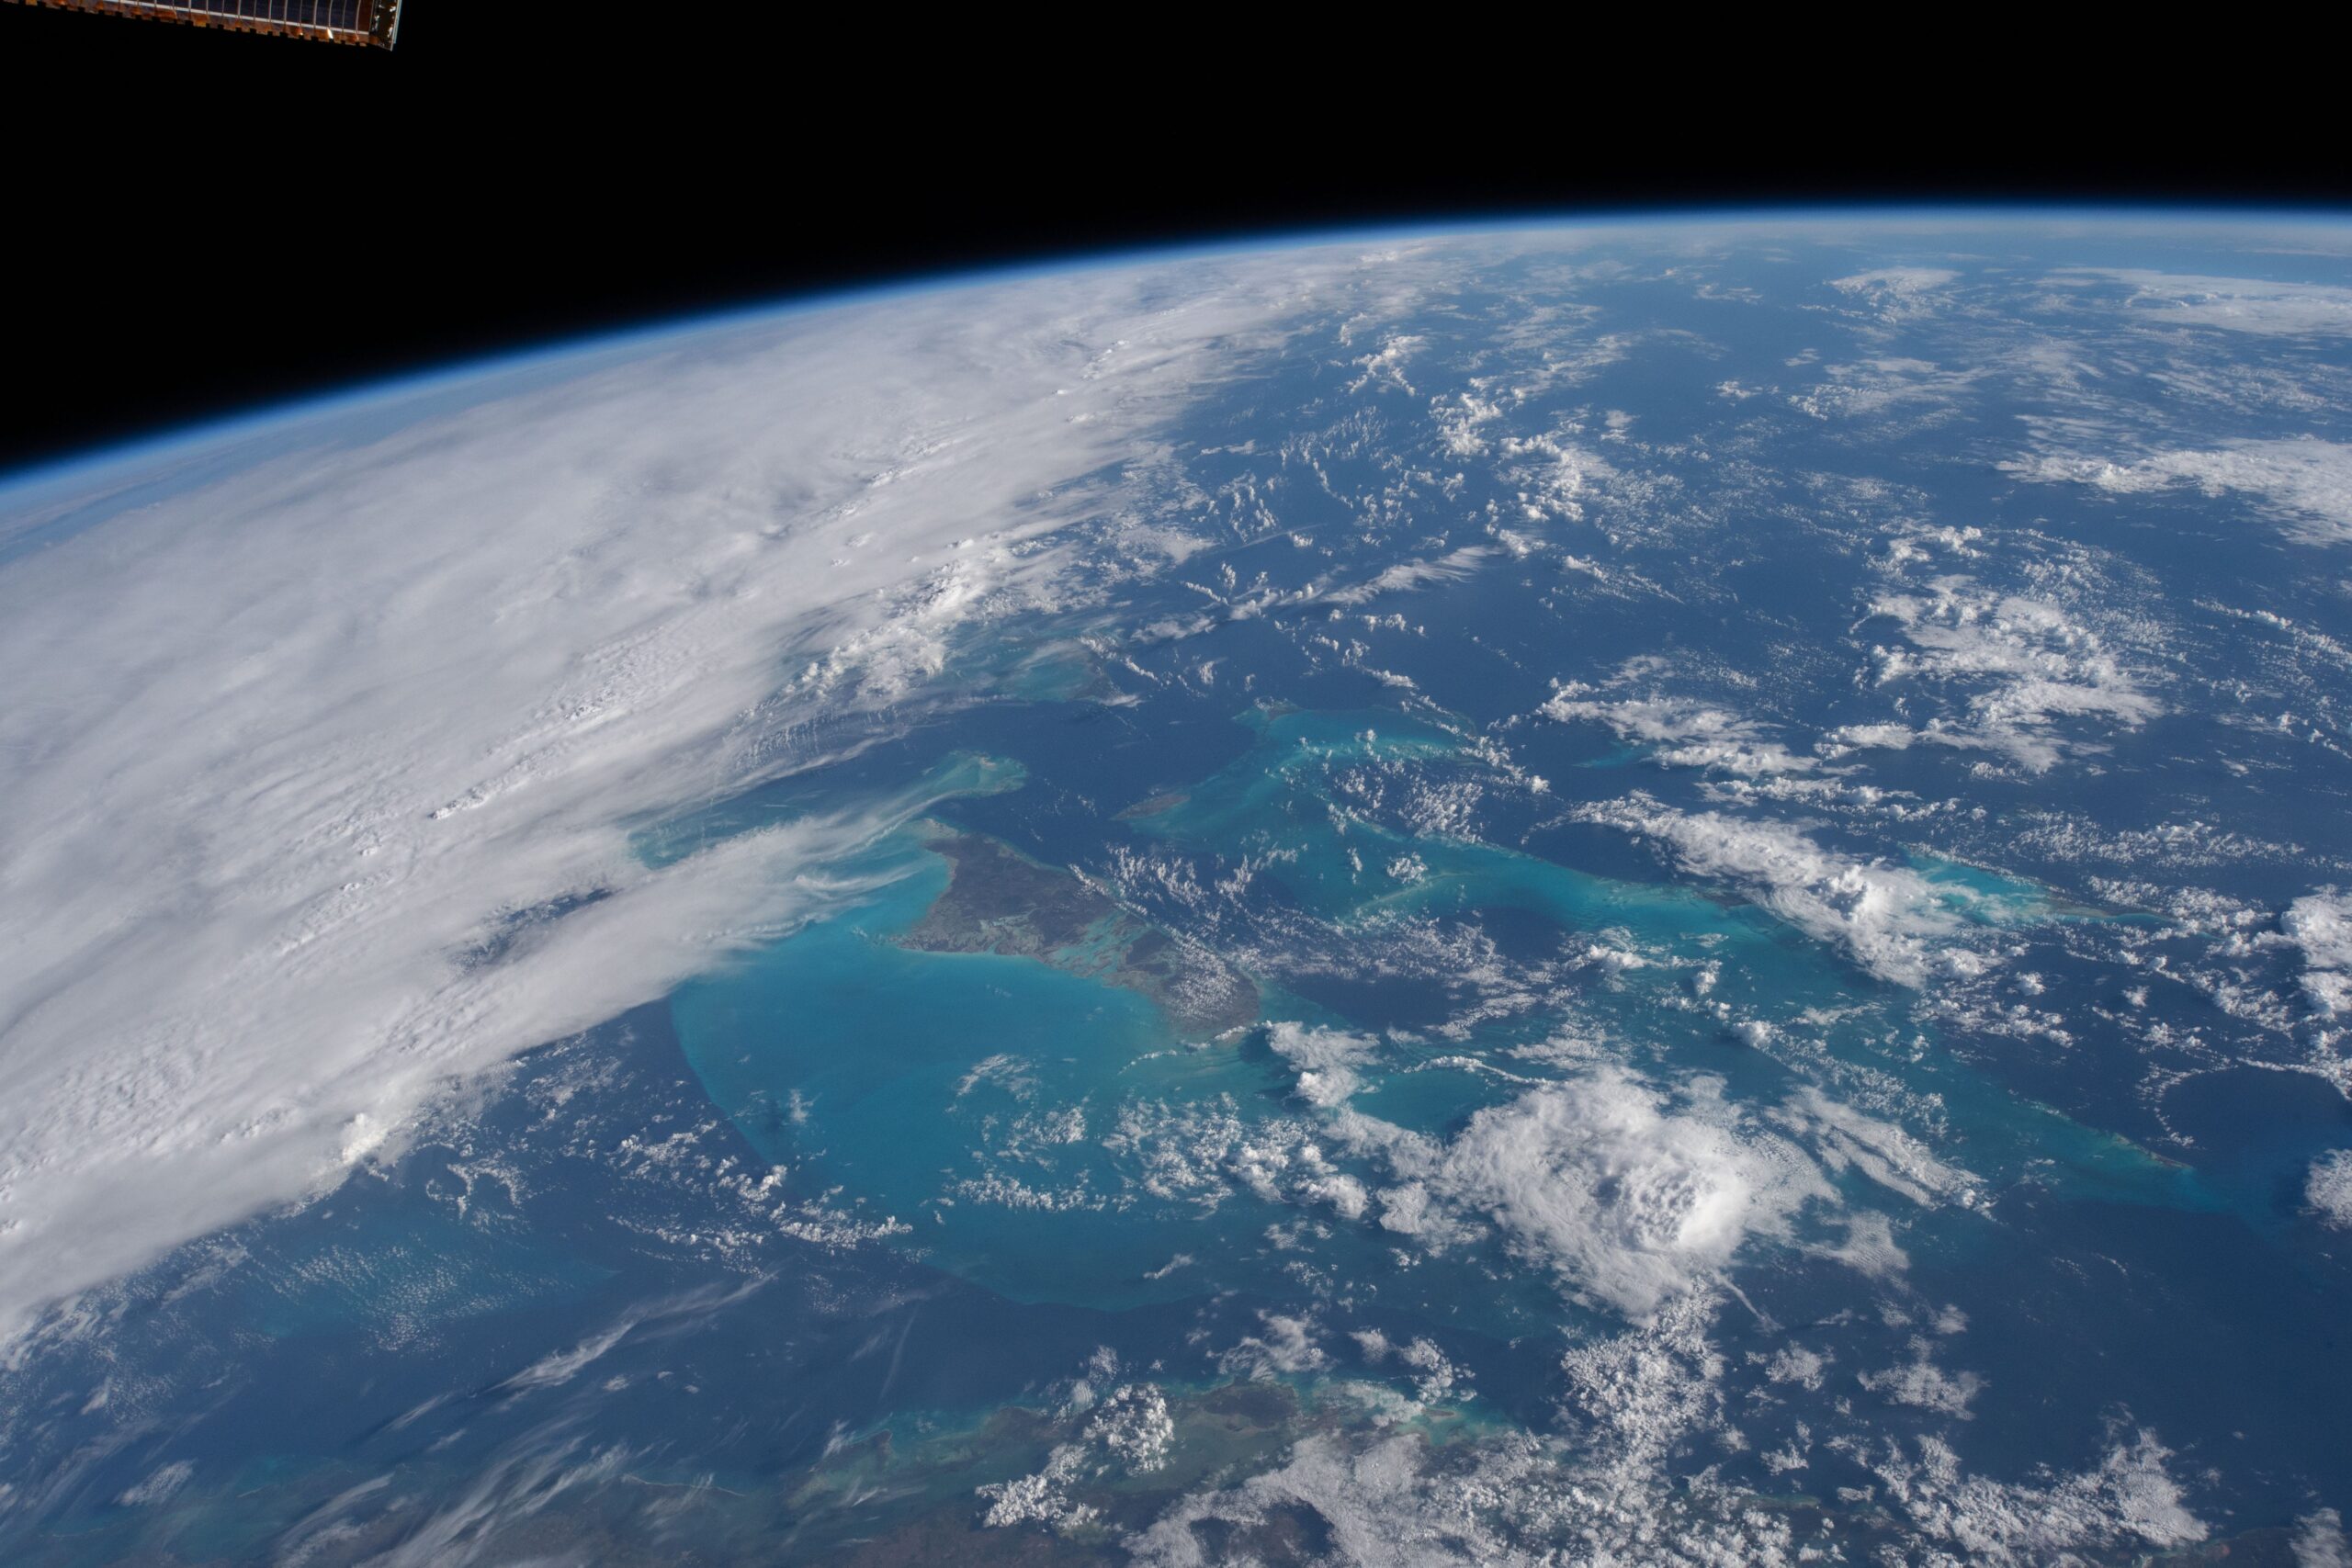
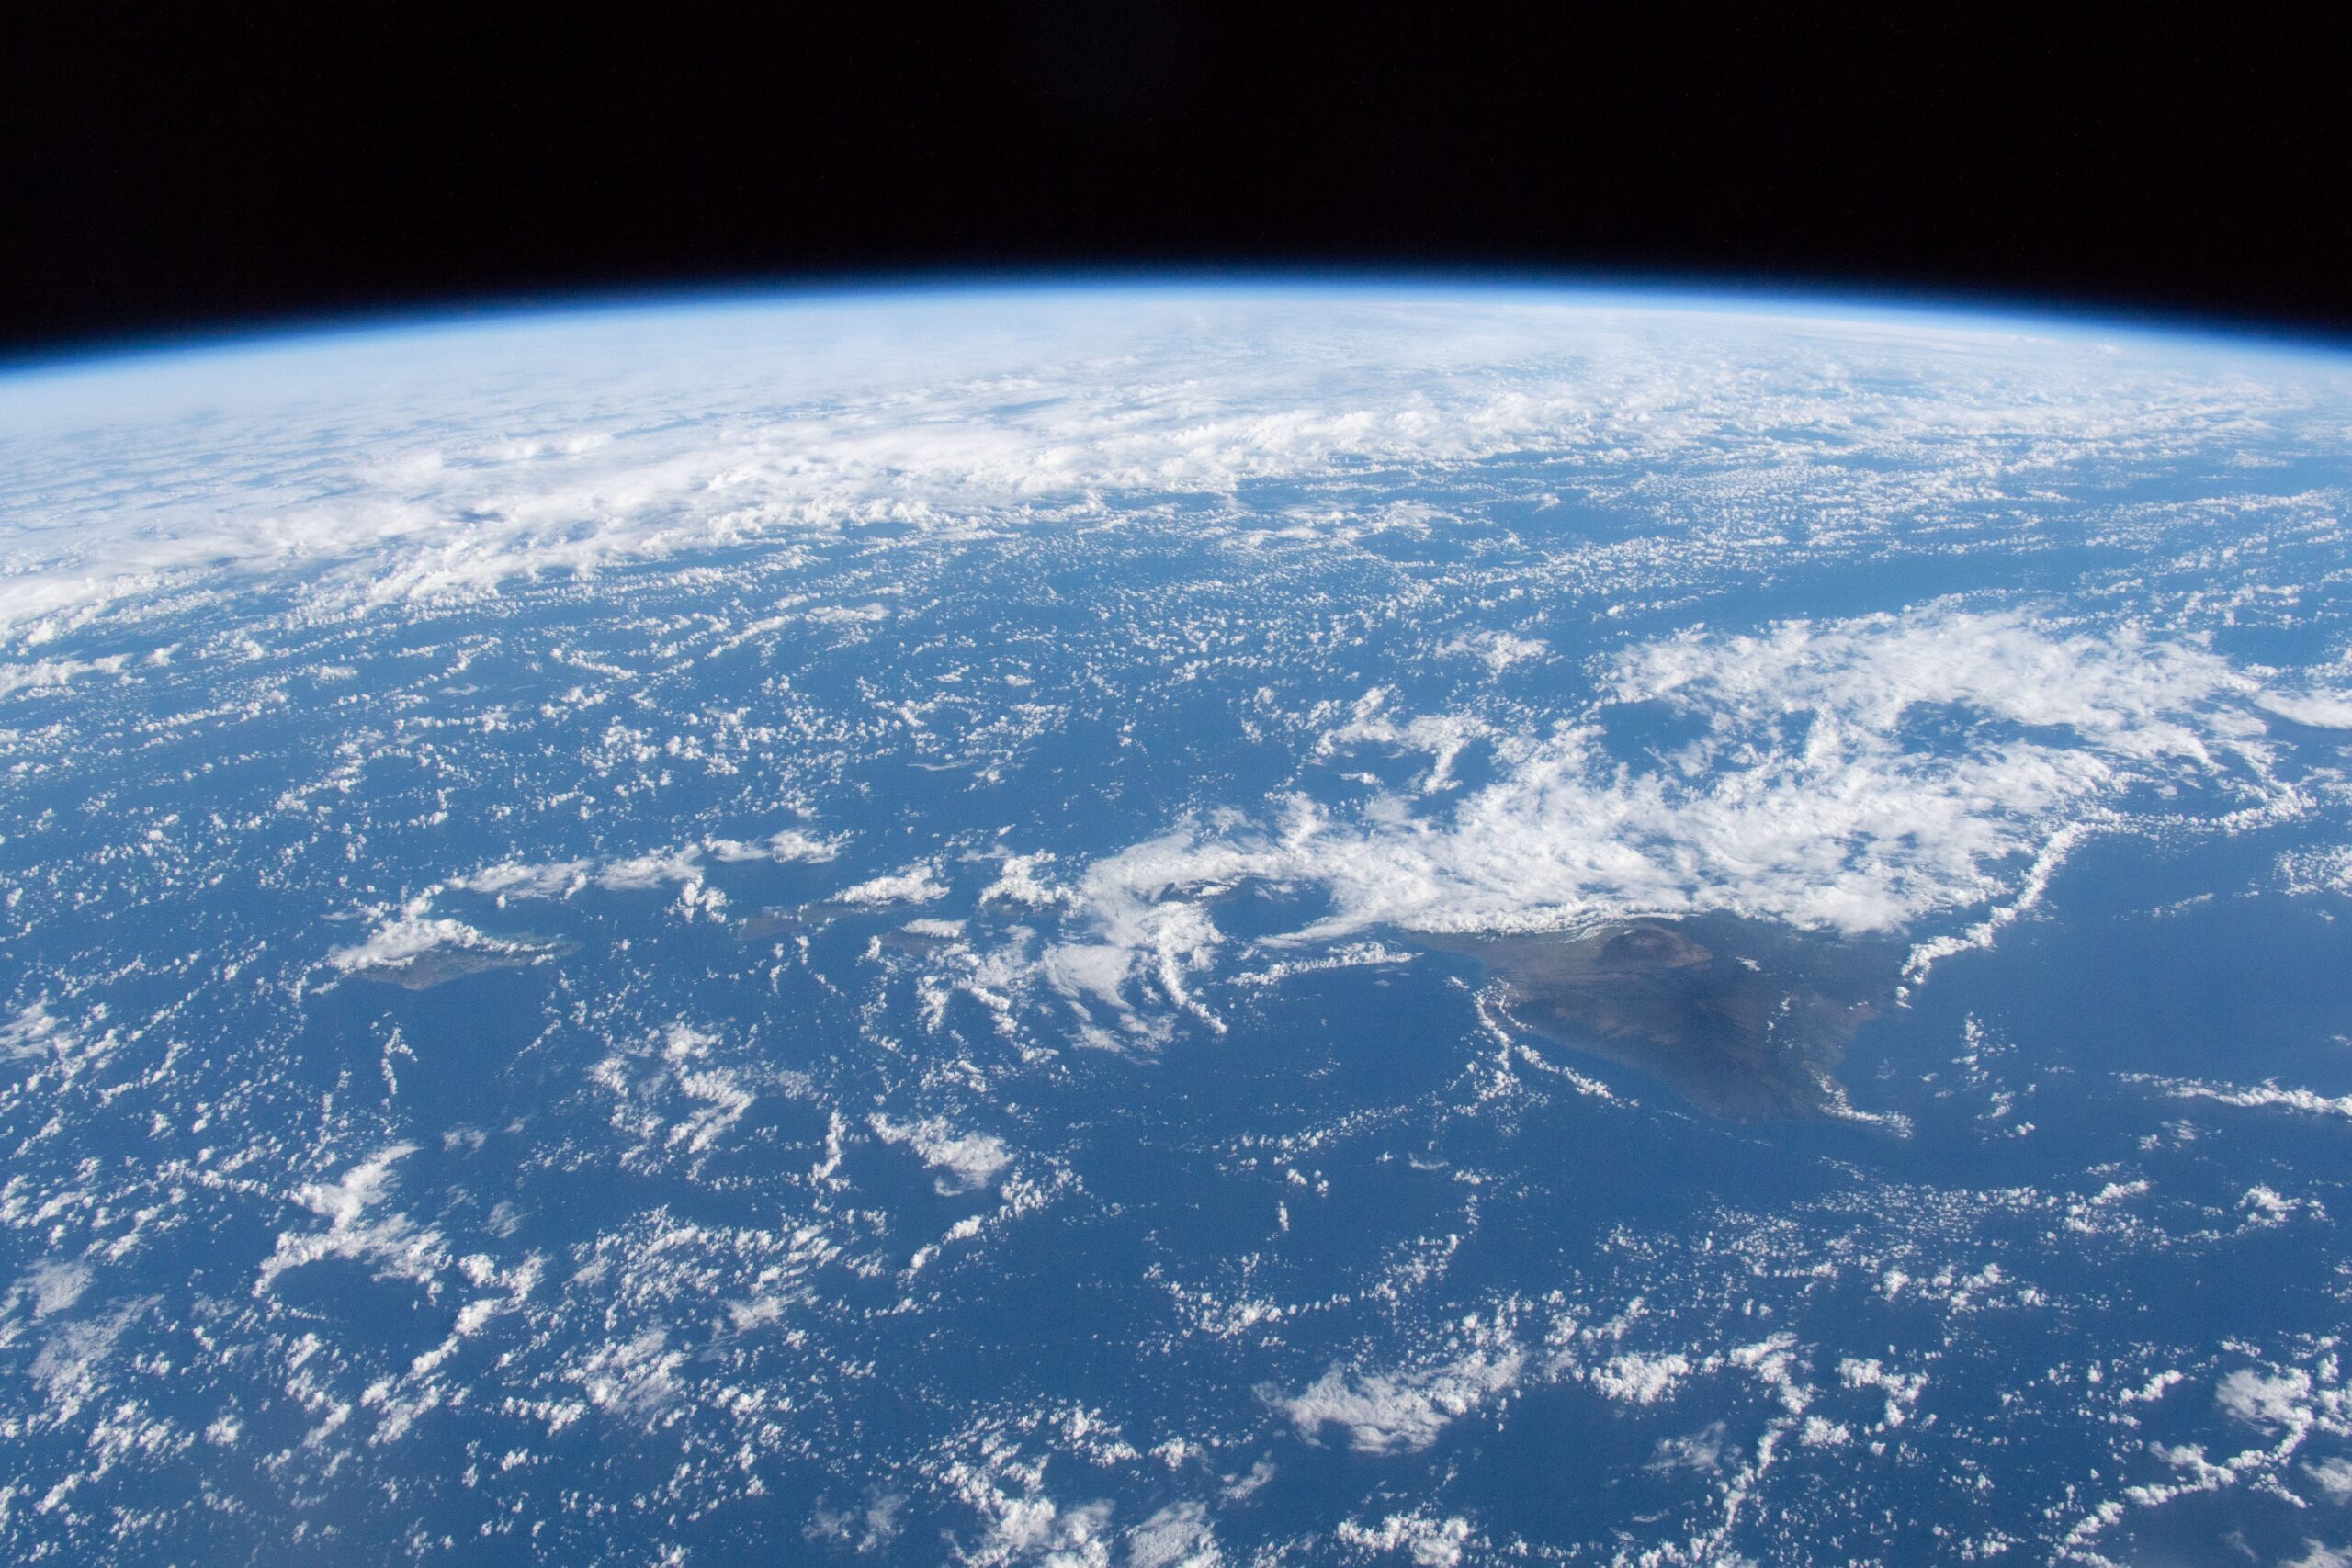
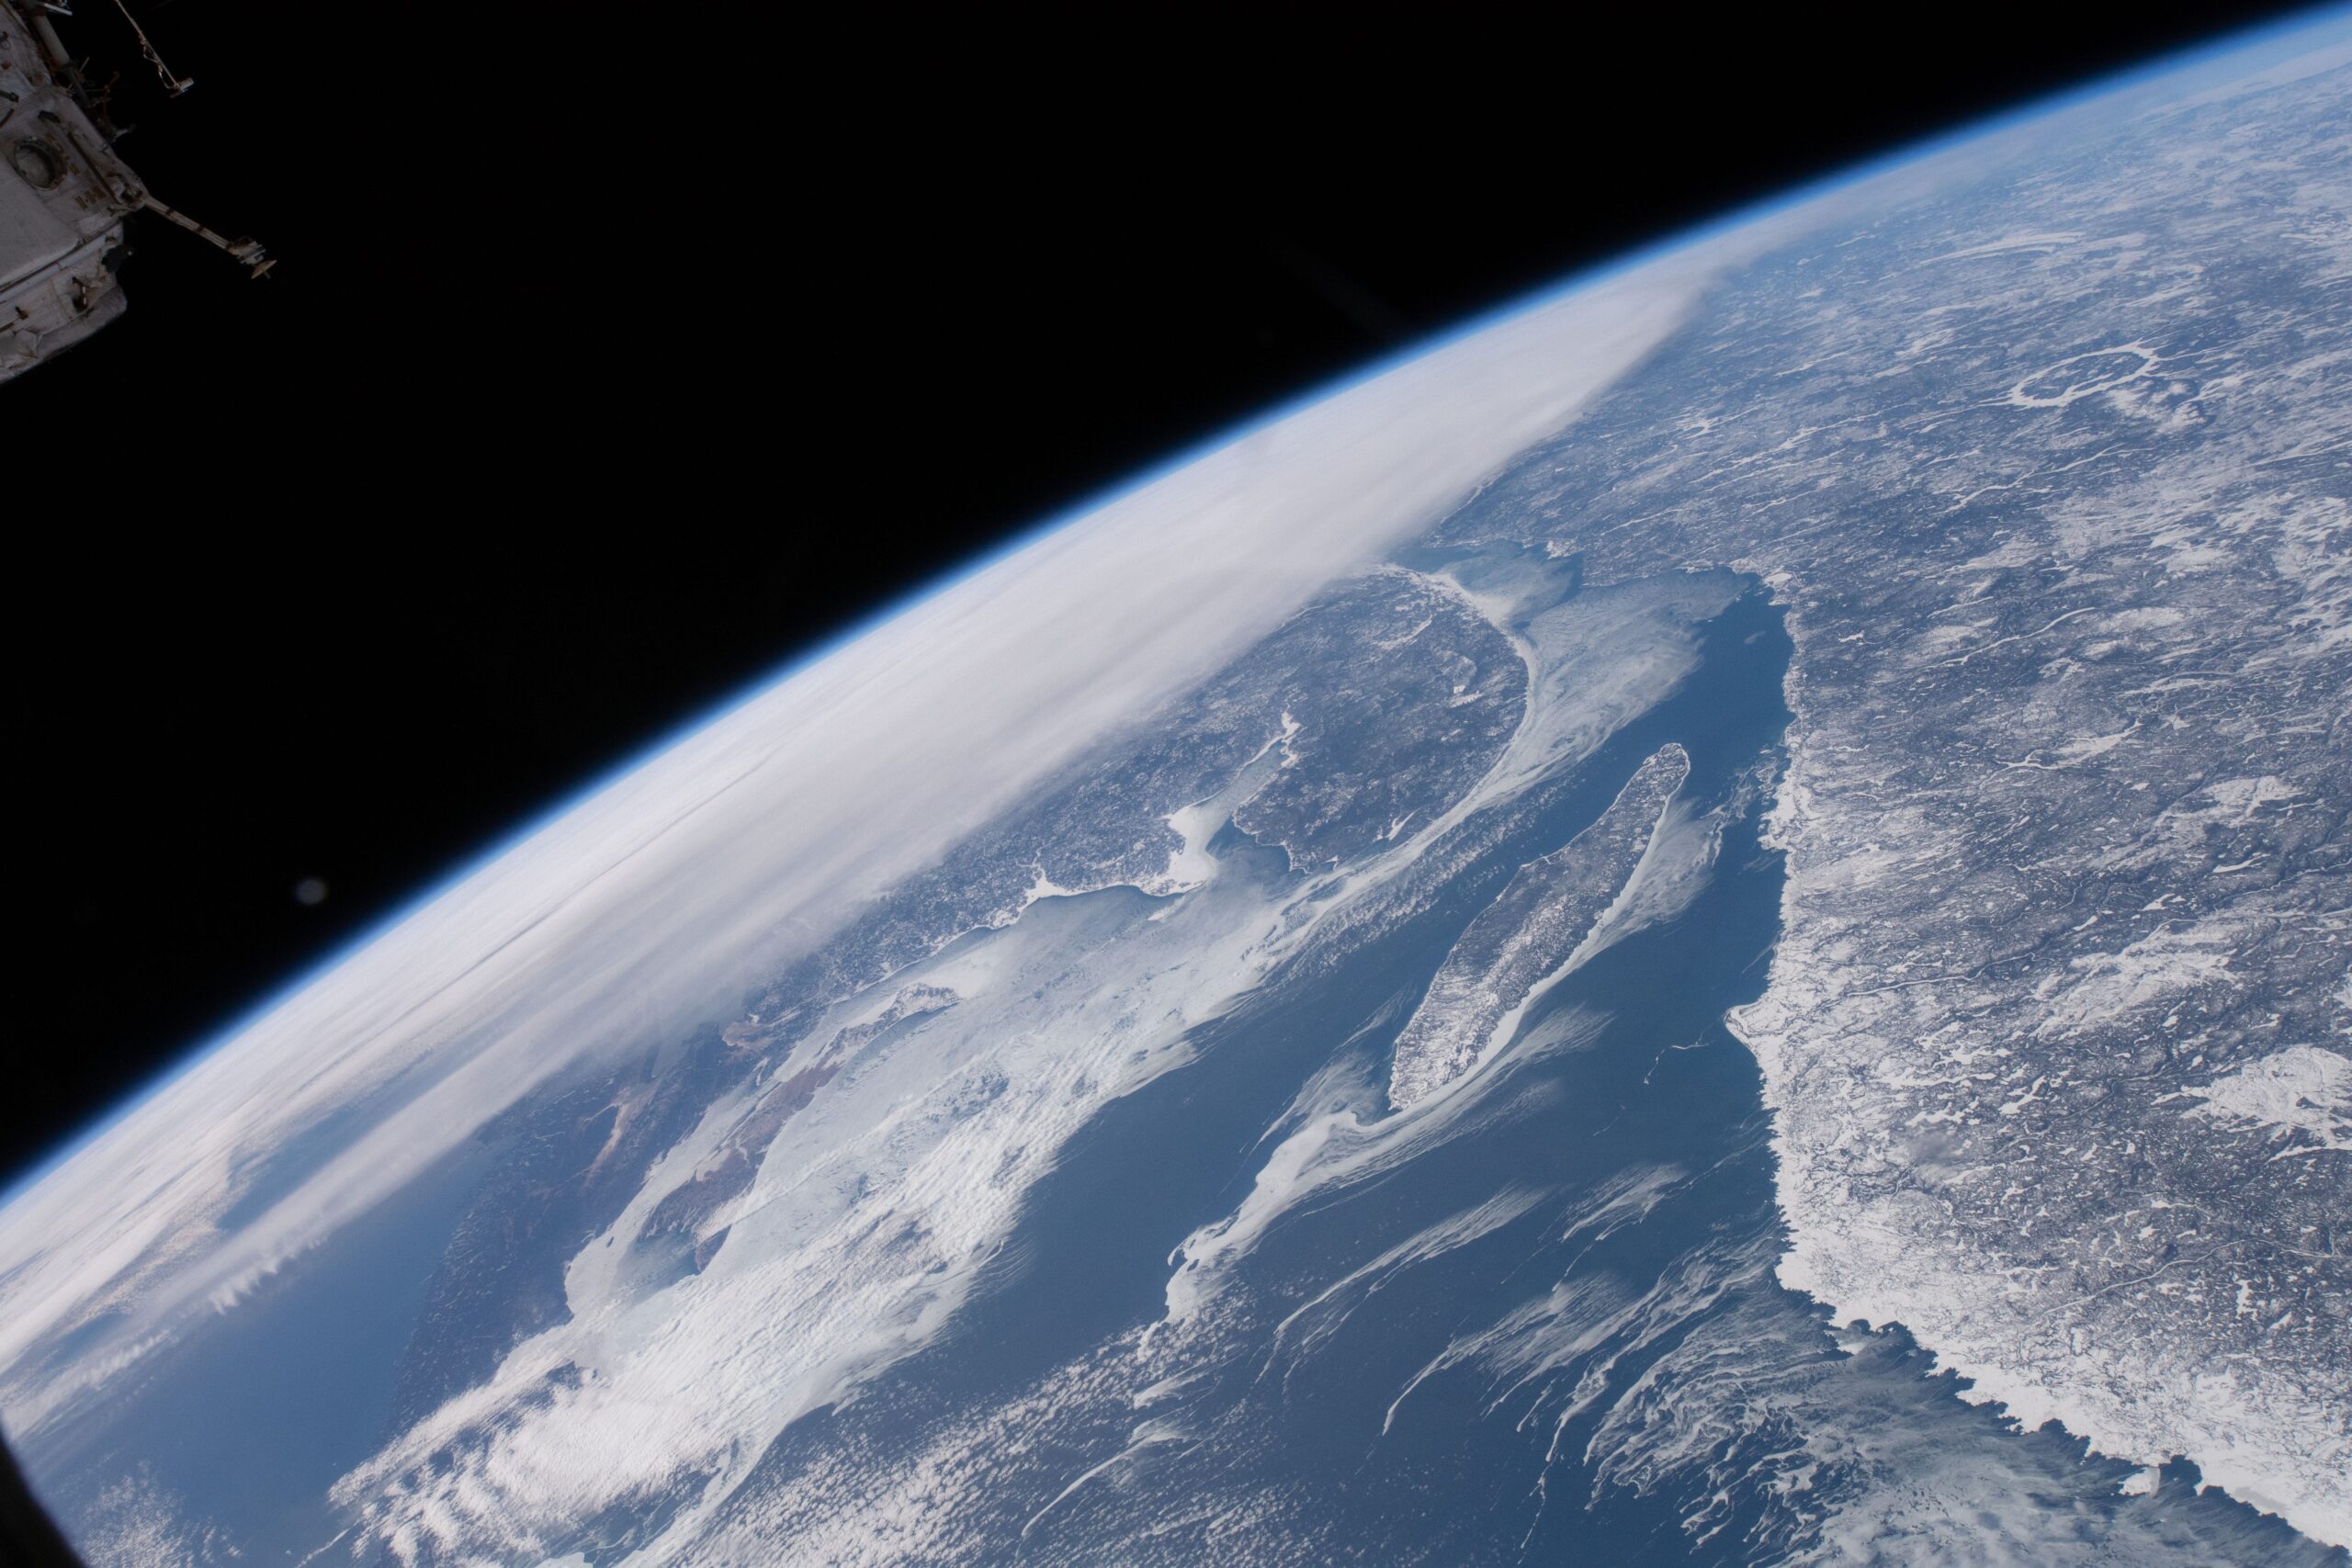
Credits : Oleg Kononenko – RSA / David Saint-Jacques – ASC / Anne McClain – NASA
To conclude this chapter and this article, we will briefly look at the so-called ‘Blue Marble’ photos. These are different photos of the Earth in its entirety, often used by conspiracy theorists.
The first ‘Blue Marble’ was taken by the crew of Apollo 17 on 7 December 1972. It is the first photo of the Earth to show it fully illuminated, although previous Apollo missions had already succeeded in photographing it almost fully illuminated. The photo in question is this one:
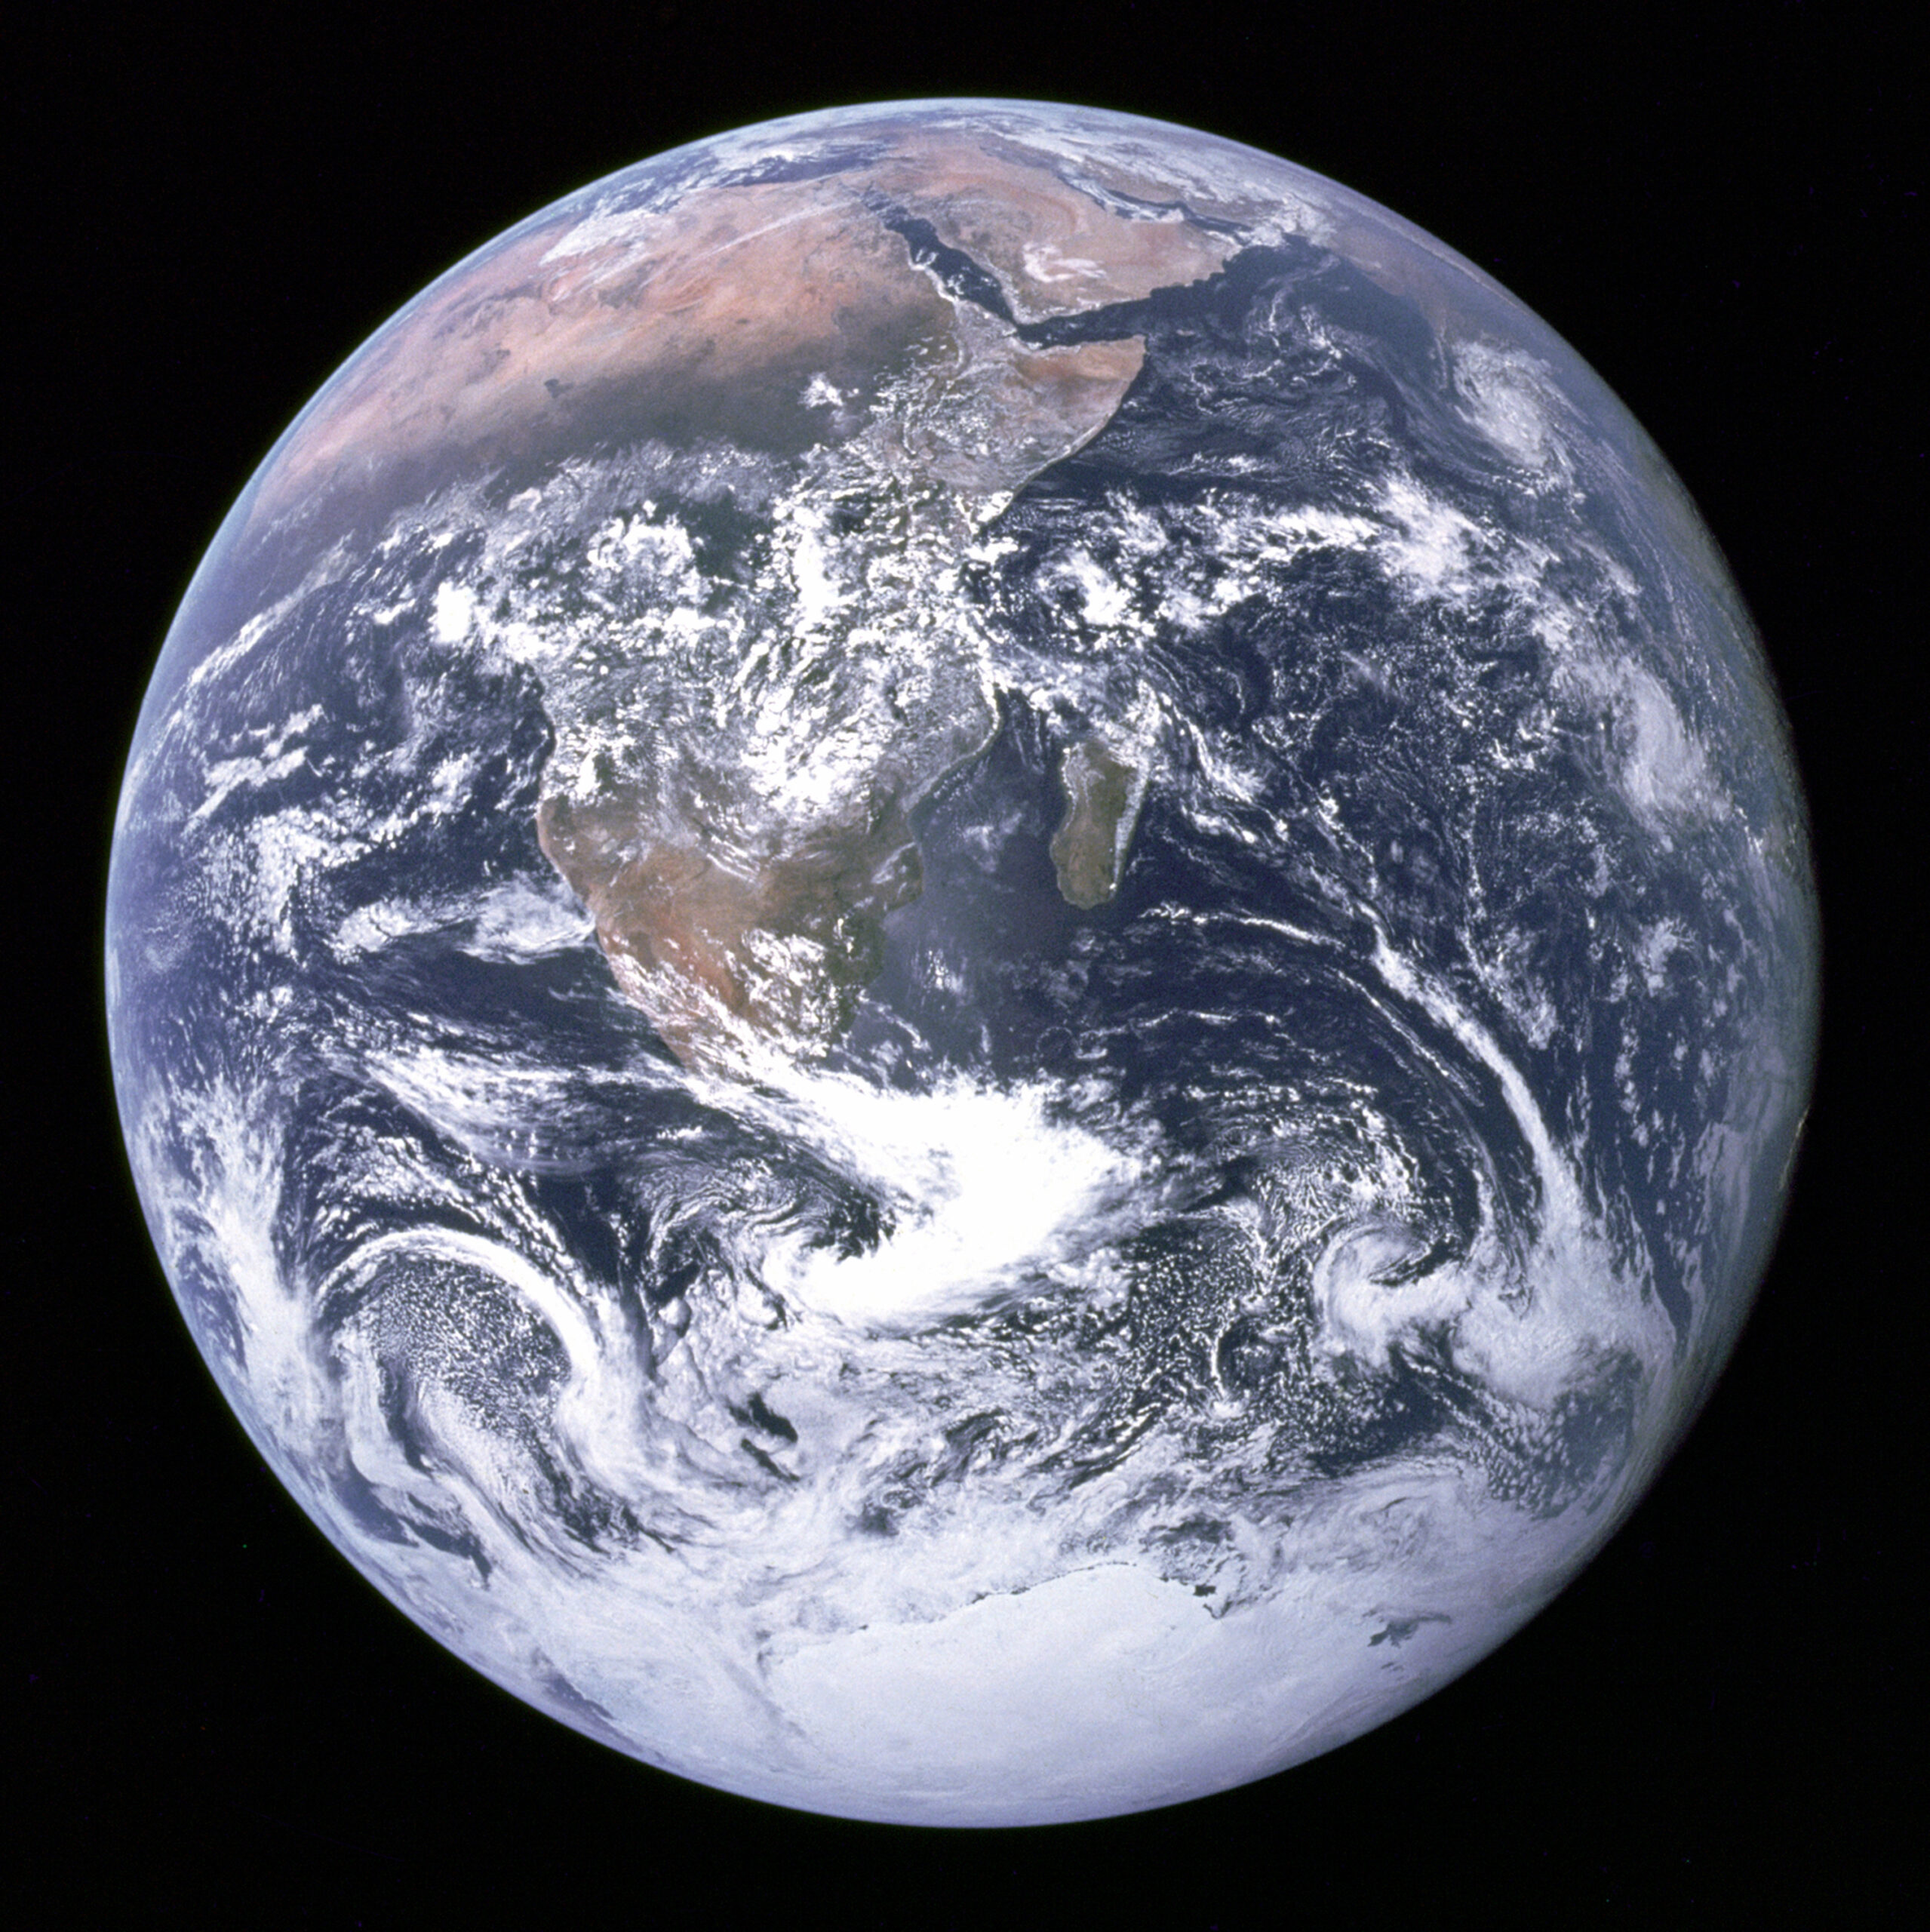
Credits : NASA / équipage Apollo 17
Subsequently, various versions of the Blue Marble were added, including the one we talked about in chapter 1.3, built by Robert Simmon using photos from the Terra satellite, which is a composite photo. We can also mention the one from 2012, constructed using data from the Suomi NPP satellite. This is also a composite photo.
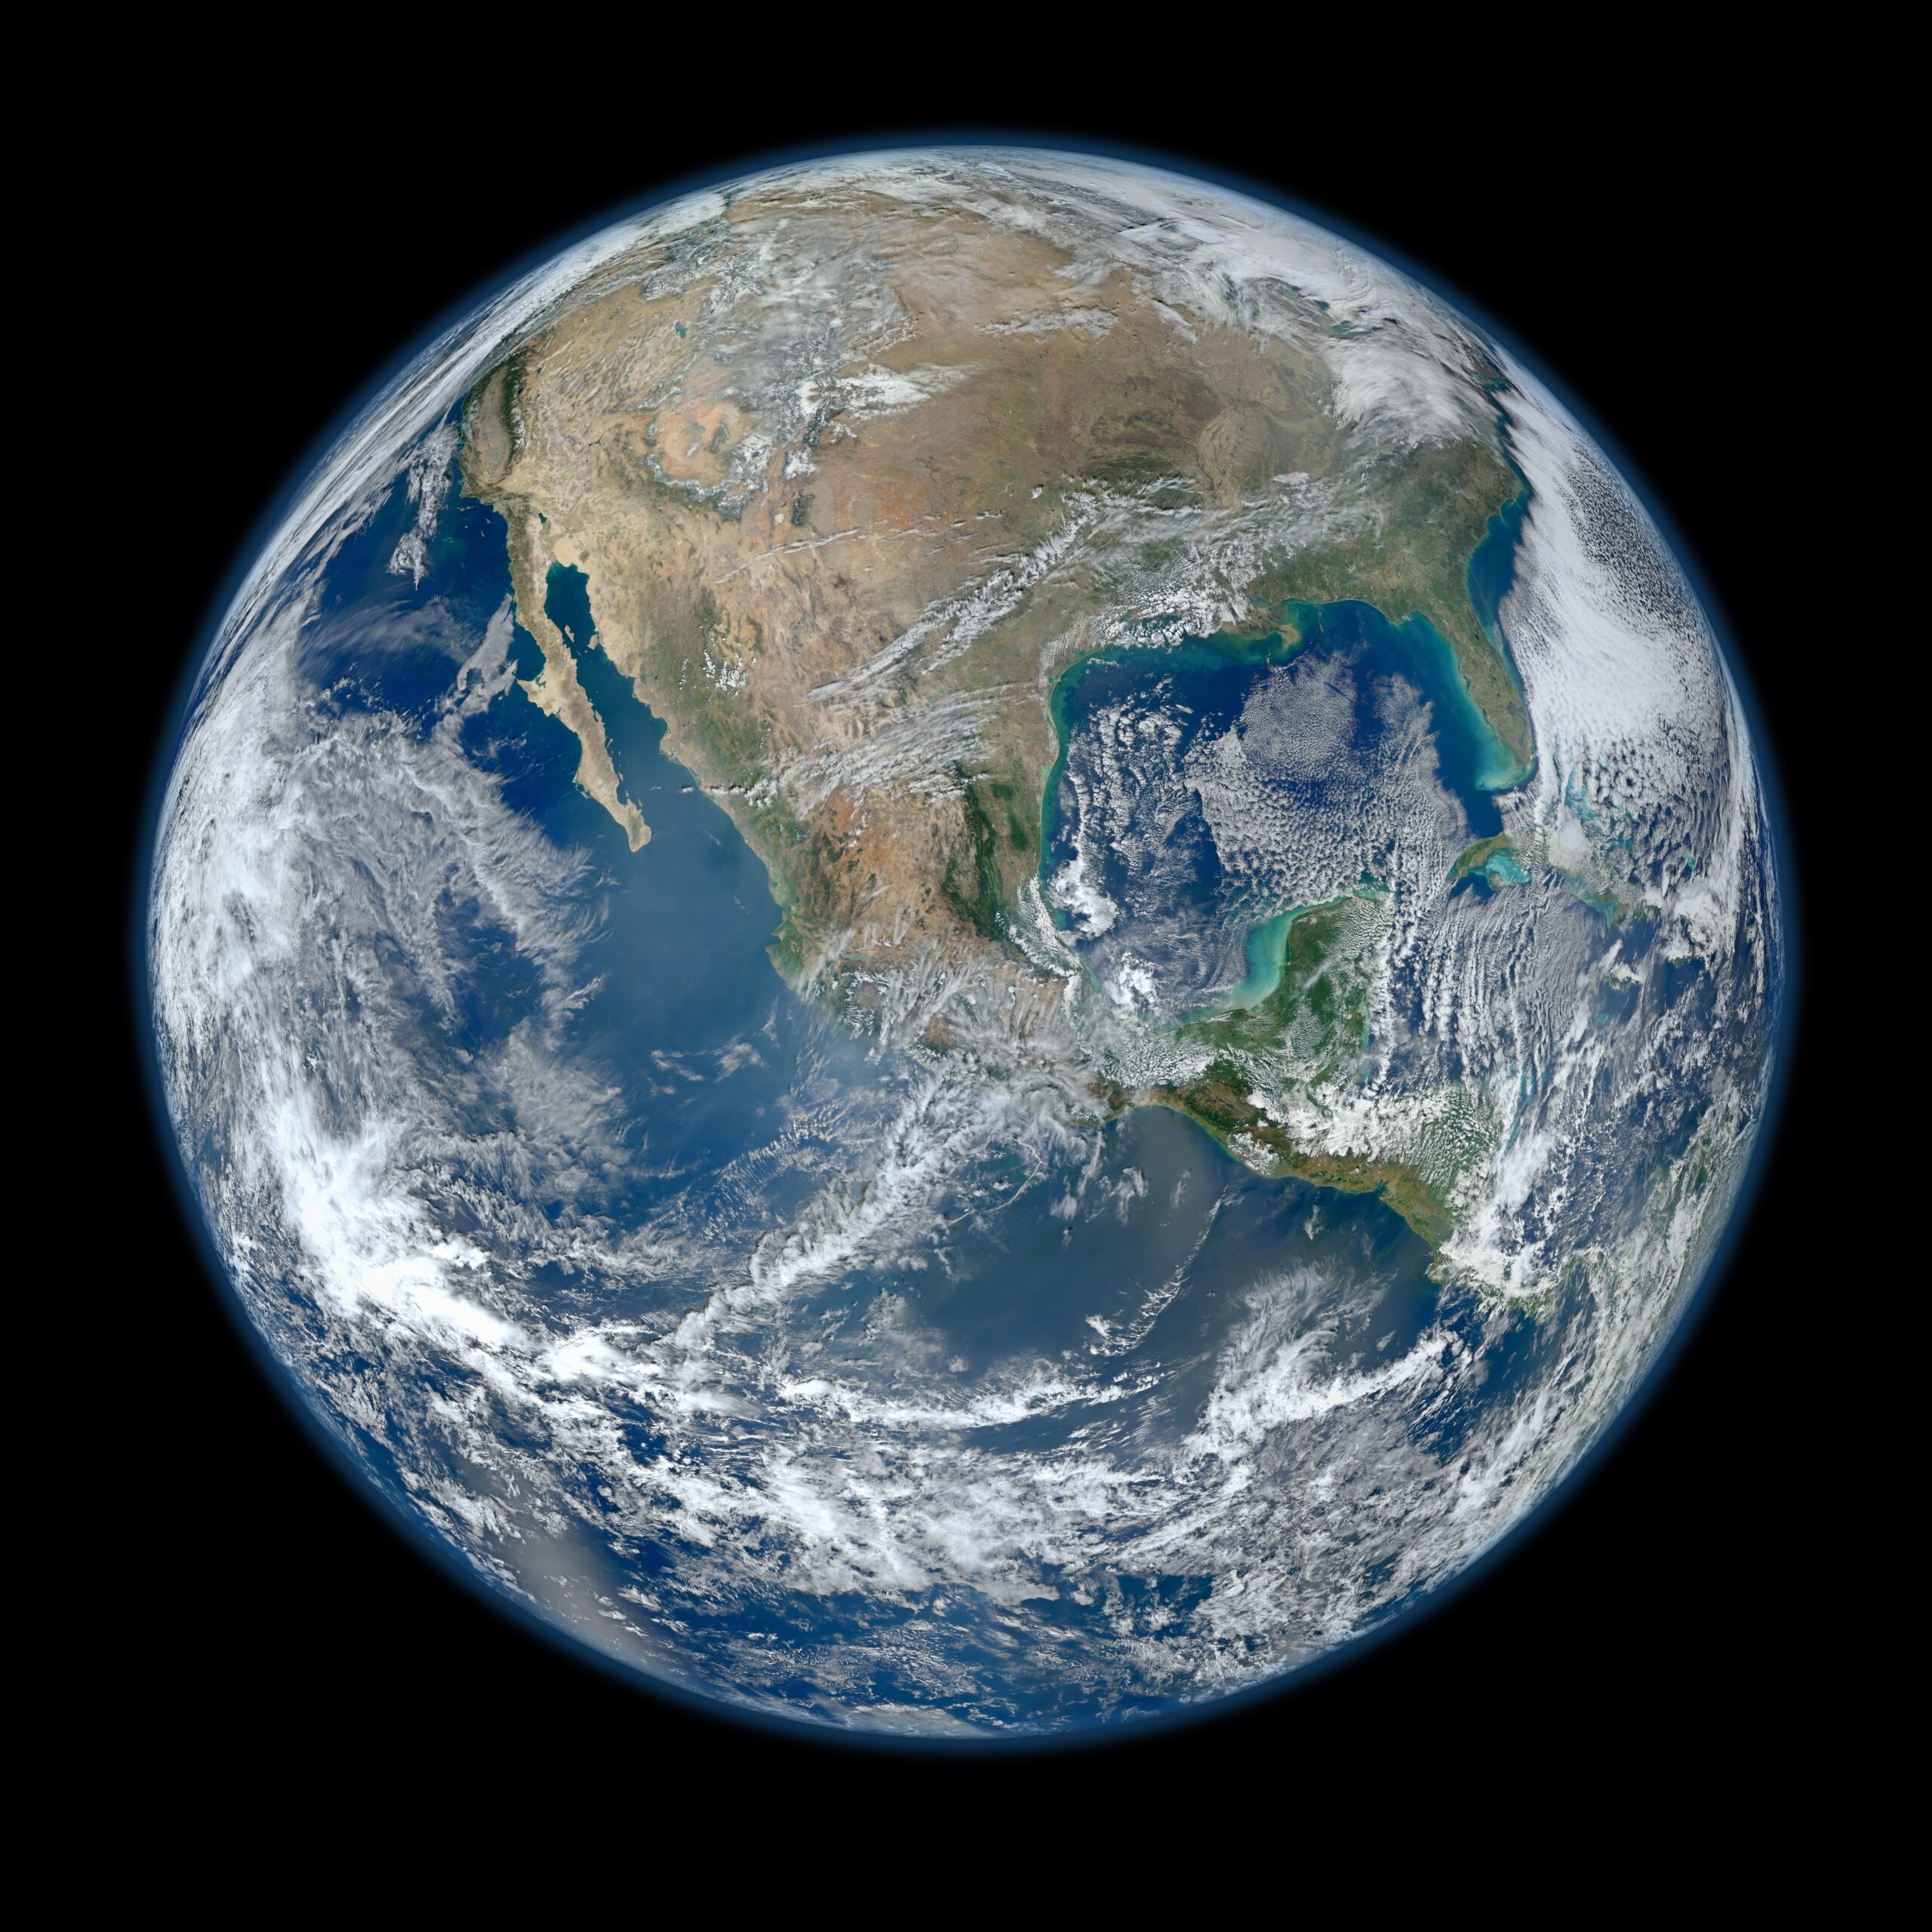
Credits : NASA / NOAA / GSFC / Suomi NPP / VIIRS /Norman Kuring
Here is another ‘Blue Marble’ taken by the DSCOVR satellite 50 years after the first Apollo 17 image. Although also a composite, the Earth has been captured in its entirety without any manipulation other than superimposing the three photos taken in the red, green and blue wavelengths:
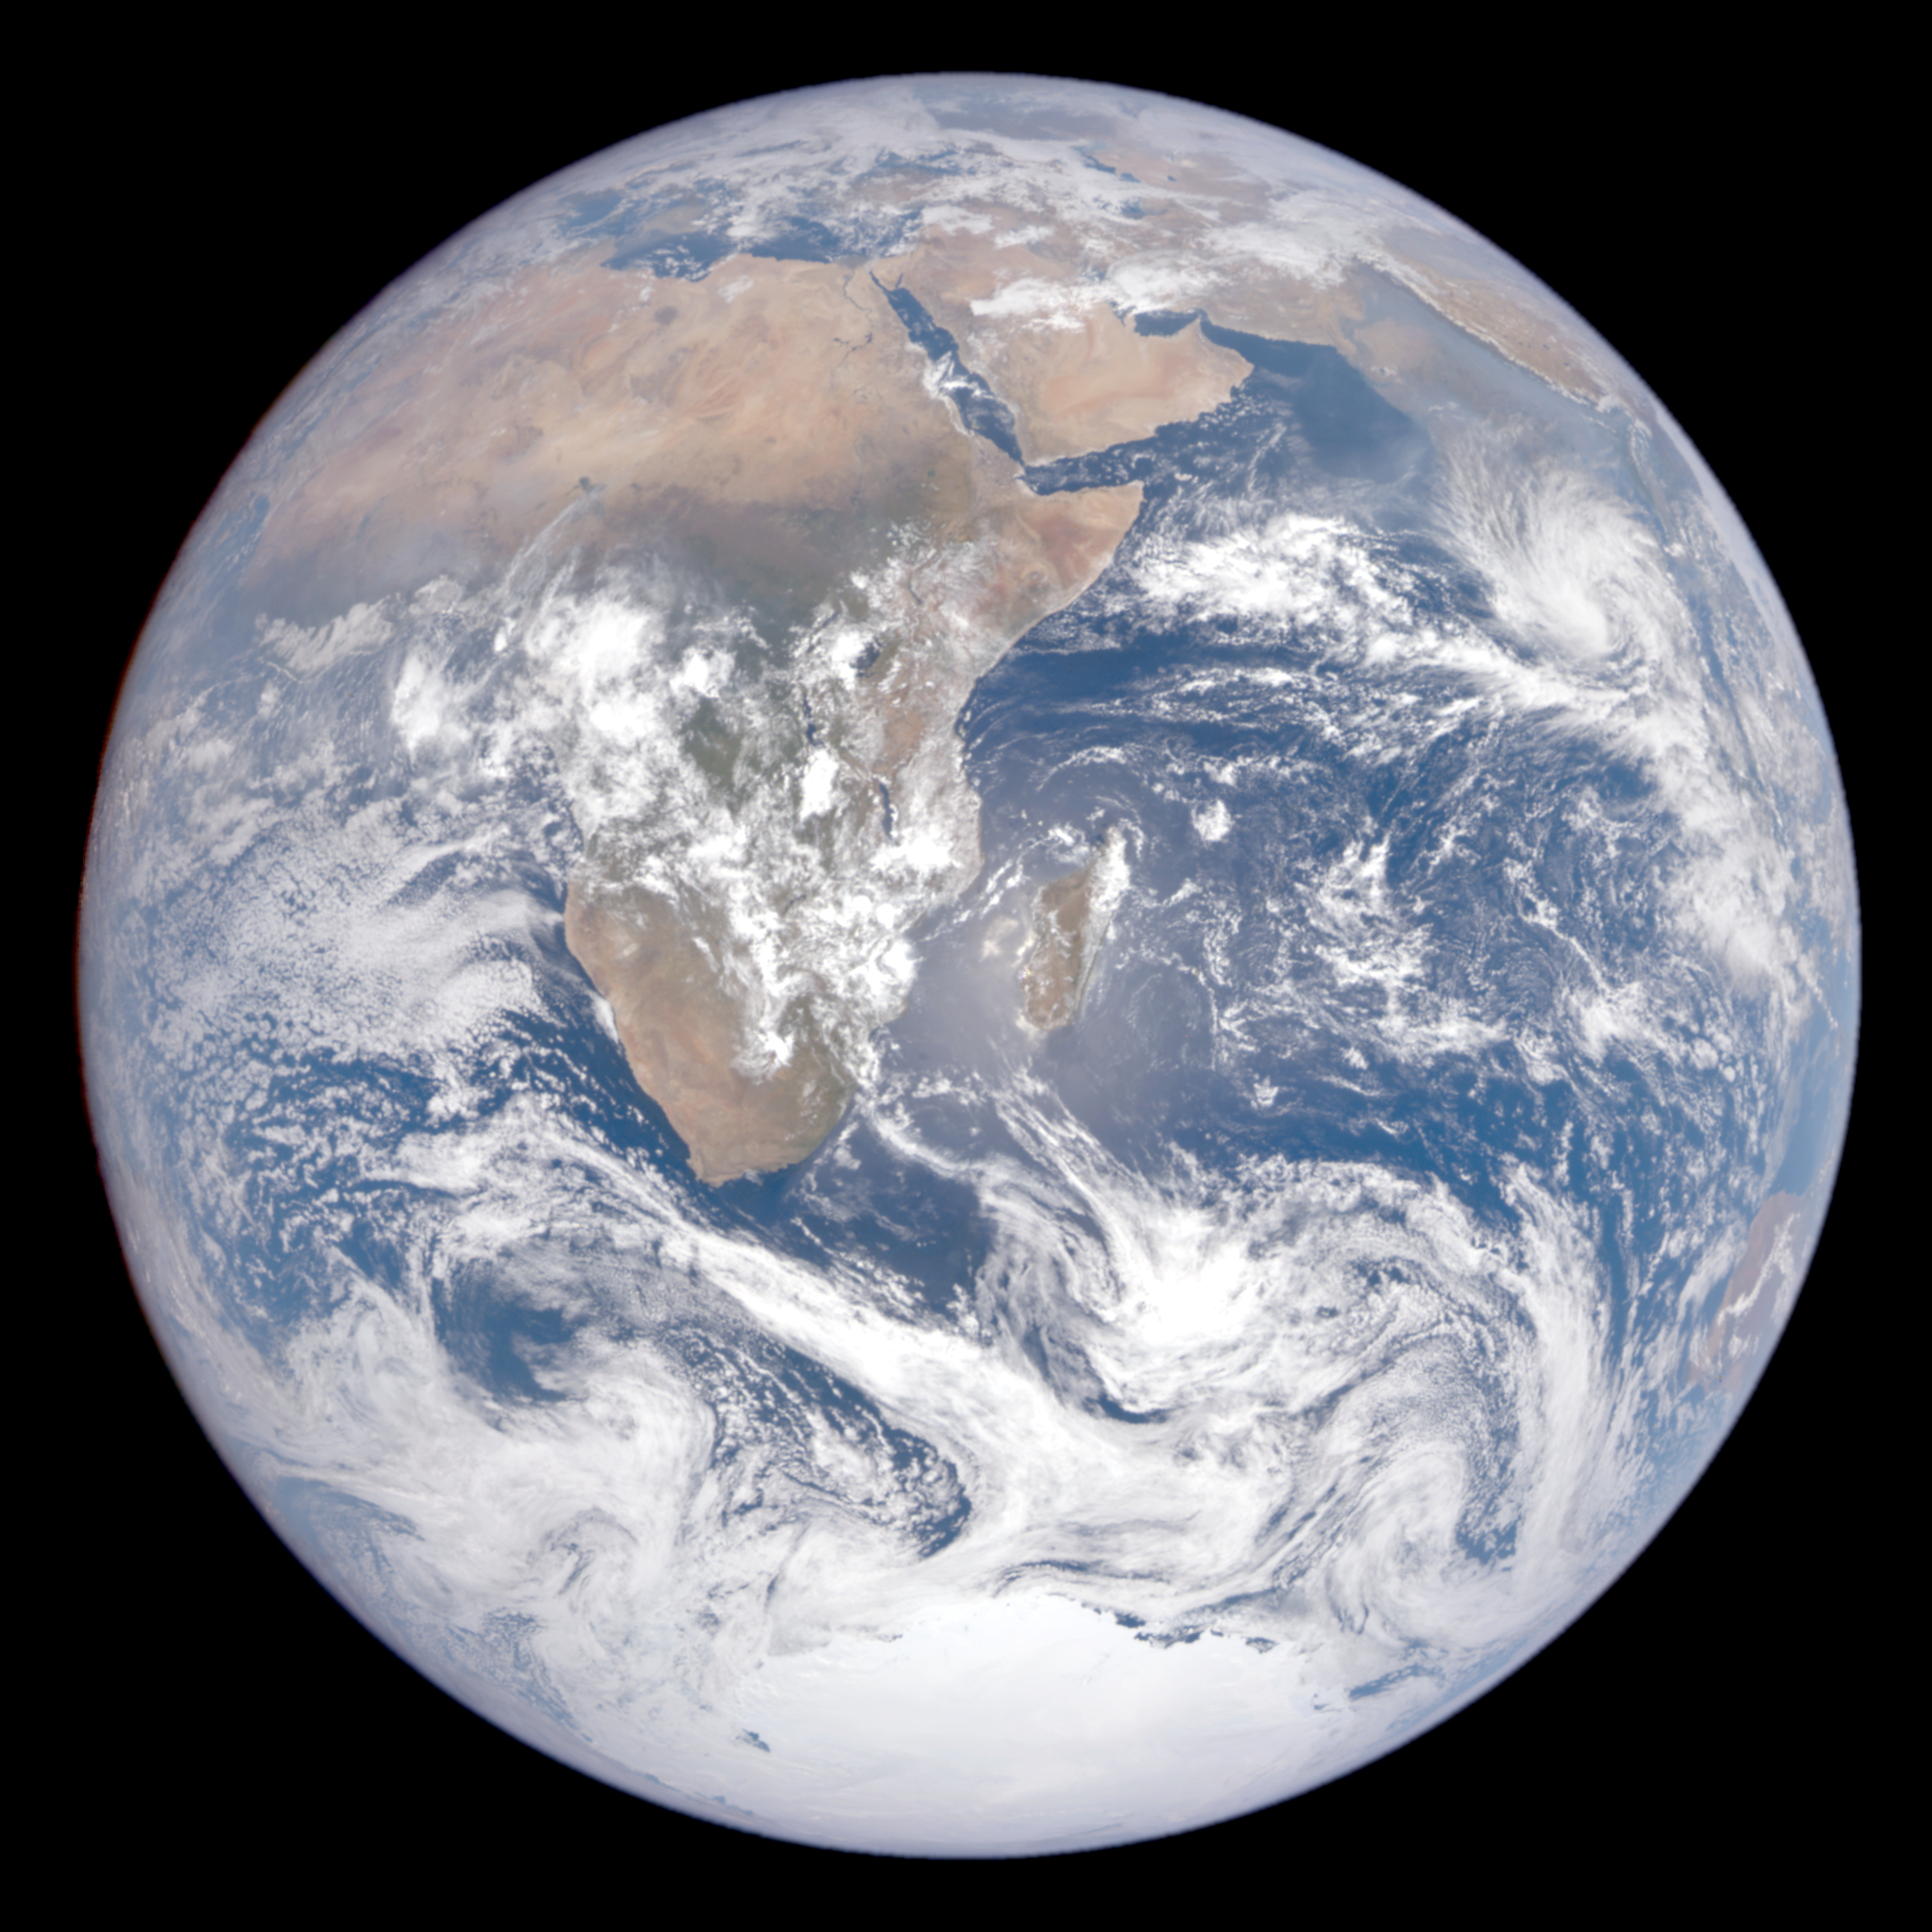
Credits : NASA / NASA EPIC Team
That’s it, this article is over, I hope it has made you dream and that composite photos now hold no secrets for you.
If you’re interested, I’ve also written an article about false colour photos:
Sources & Crédits
- Panorama of Mars : https://photojournal.jpl.nasa.gov/catalog/PIA23623
- Panorama of the Moon : https://www.lpi.usra.edu/resources/apollopanoramas/pans/?pan=JSC2004e52772
- Apollo Lunar Surface Experiment : https://fr.wikipedia.org/wiki/Apollo_Lunar_Surface_Experiments_Package
- Radioisotope thermoelectric generator : https://fr.wikipedia.org/wiki/G%C3%A9n%C3%A9rateur_thermo%C3%A9lectrique_%C3%A0_radioisotope_multi-mission
- EPIC : https://epic.gsfc.nasa.gov/about/epic
- DSCOVR : https://www.nesdis.noaa.gov/current-satellite-missions/currently-flying/dscovr-deep-space-climate-observatory
- Low Earth orbit : https://fr.wikipedia.org/wiki/Orbite_terrestre_basse
- List of artificial satellites and their orbits : https://space.oscar.wmo.int/satellites
- MODIS : https://fr.wikipedia.org/wiki/Moderate-Resolution_Imaging_Spectroradiometer
- Terra : https://fr.wikipedia.org/wiki/Terra_(satellite)
- Aqua : https://fr.wikipedia.org/wiki/Aqua_(satellite)
- Orbit and coverage of PACE : https://svs.gsfc.nasa.gov/5185/
- NASA Worldview : https://worldview.earthdata.nasa.gov/
- Combination of Terra and Aqua photos : https://svs.gsfc.nasa.gov/31223/
- Blue Marble : https://fr.wikipedia.org/wiki/La_Bille_bleue
- Blue Marble 2001/2002 : https://visibleearth.nasa.gov/images/57723/the-blue-marble
- How is a ‘Blue Marble’ composite photo created? : https://earthobservatory.nasa.gov/blogs/elegantfigures/2011/10/06/crafting-the-blue-marble/
- CMOS sensor : https://en.wikipedia.org/wiki/Active-pixel_sensor
- CCD sensor : https://en.wikipedia.org/wiki/Charge-coupled_device
- Photosites : https://pixelcraft.photo.blog/2023/08/01/what-is-a-photosite/
- Color filter array : https://en.wikipedia.org/wiki/Color_filter_array
Comments are closed.


